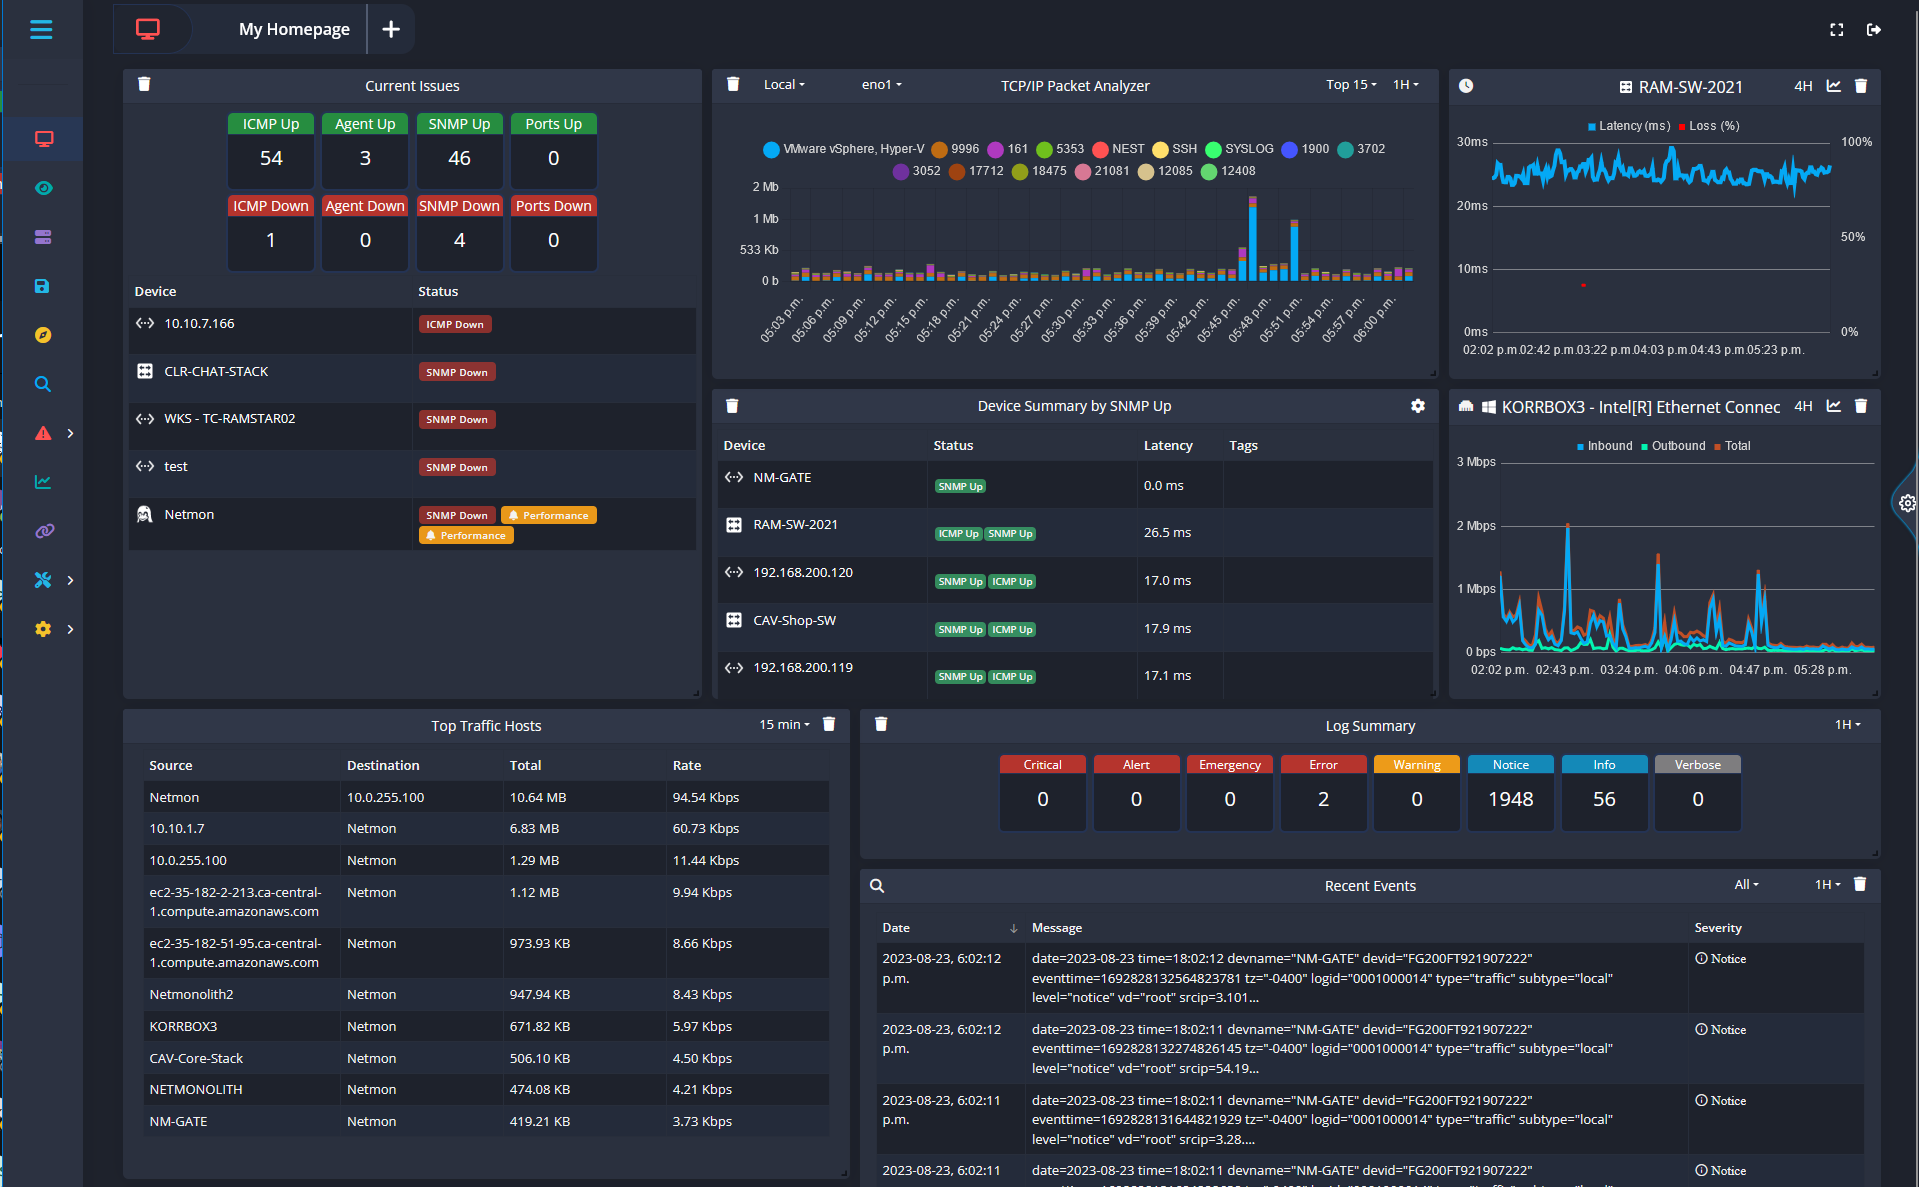
Home Dashboard
The Home Dashboard provides a launch point to display several different data sources to suit the users requirements. This is designed to provide an overview of the Network status.
Using the Dashboard
The Dashboard is designed to provide an overview of key information about your network. It can be customized with various widgets to suit your specific needs. The dashboard also includes a pop-out sidebar for easy configuration and widget selection.
Accessing the Dashboard
After logging into your account, navigate to the Dashboard through the main navigation menu.
Understanding the Settings Sidebar
The Dashboard Sidebar is a key feature in customizing your Dashboard view. It allows you to add various widgets to the main Dashboard area. Widgets can range from displaying current issues, traffic data, network devices, log summaries, performance information and more.
To access the Dashboard Sidebar, click the sprocket on the right side of your screen.
Adding Widgets
The Dashboard Sidebar provides a range of widgets that you can add to your Dashboard.
To add a widget
- Open the Dashboard Sidebar.
- You will see a list of available widgets, each with a title and description.
- Click on the widget you want to add.
- The selected widget will be automatically added to your Dashboard.
Available Widgets
- Current Issues: Displays a table view of currently active issues.
- Protocol Analyzer: Displays traffic data in a stacked bar chart.
- Local Network Hosts: Displays a table view of LAN-local discovered network devices.
- Device Summary by Tag: Displays a table view of devices with the selected tags.
- Log Summary: Displays a summary of the number of log entries.
- Logs: Displays a table view of event/syslog data.
- Most Active Hosts: Displays a table view of the top bandwidth consumers.
Resetting Dashboard Layout
If you want to revert back to the original dashboard layout:
- 1. Open the Dashboard Sidebar.
- 2. Scroll down to the bottom.
- 3. Click on the “Reset Dashboard” button.
**Note:** This action will remove all the widgets you’ve added and restore the dashboard to its original state.
Your settings and preferences for the dashboard are saved per-user, so you can personalize your dashboard without affecting other users Dashboards.
Customizing Widgets
Many widgets offer further customization options, such as selecting specific tags for the Device Summary, or choosing different categories of logs to display. After adding a widget to your dashboard, click on any available settings or options within the widget to customize it to your needs.
Keep in mind that the dashboard is designed to provide a quick, at-a-glance understanding of your network’s status and activity. Be sure to add and customize widgets that provide the most valuable information for your needs.
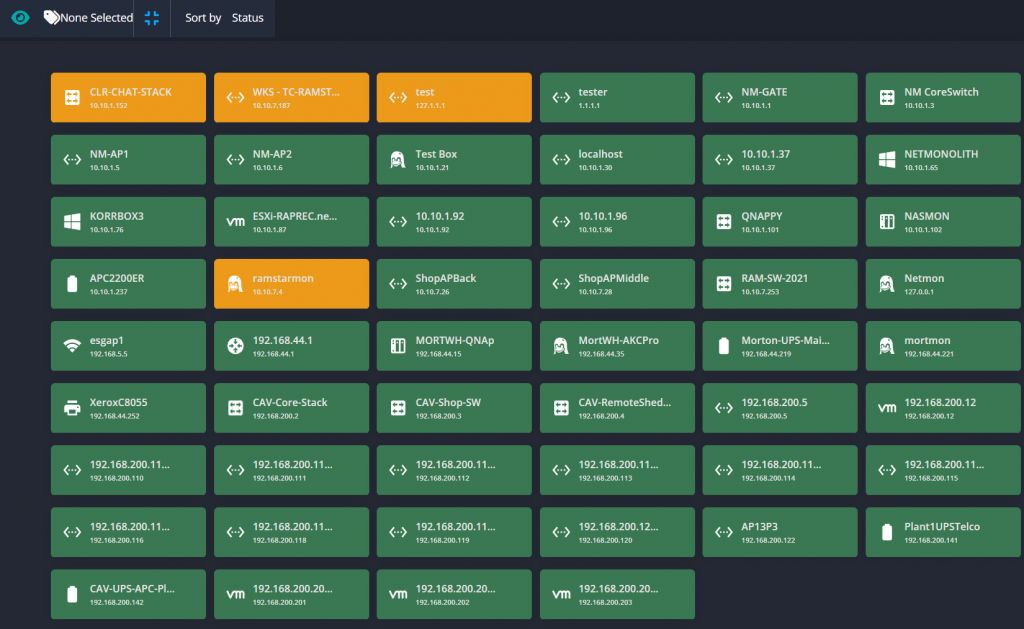
Device Overwatch
Device Overwatch is used to display all devices with brief summary of statistics regarding each device.
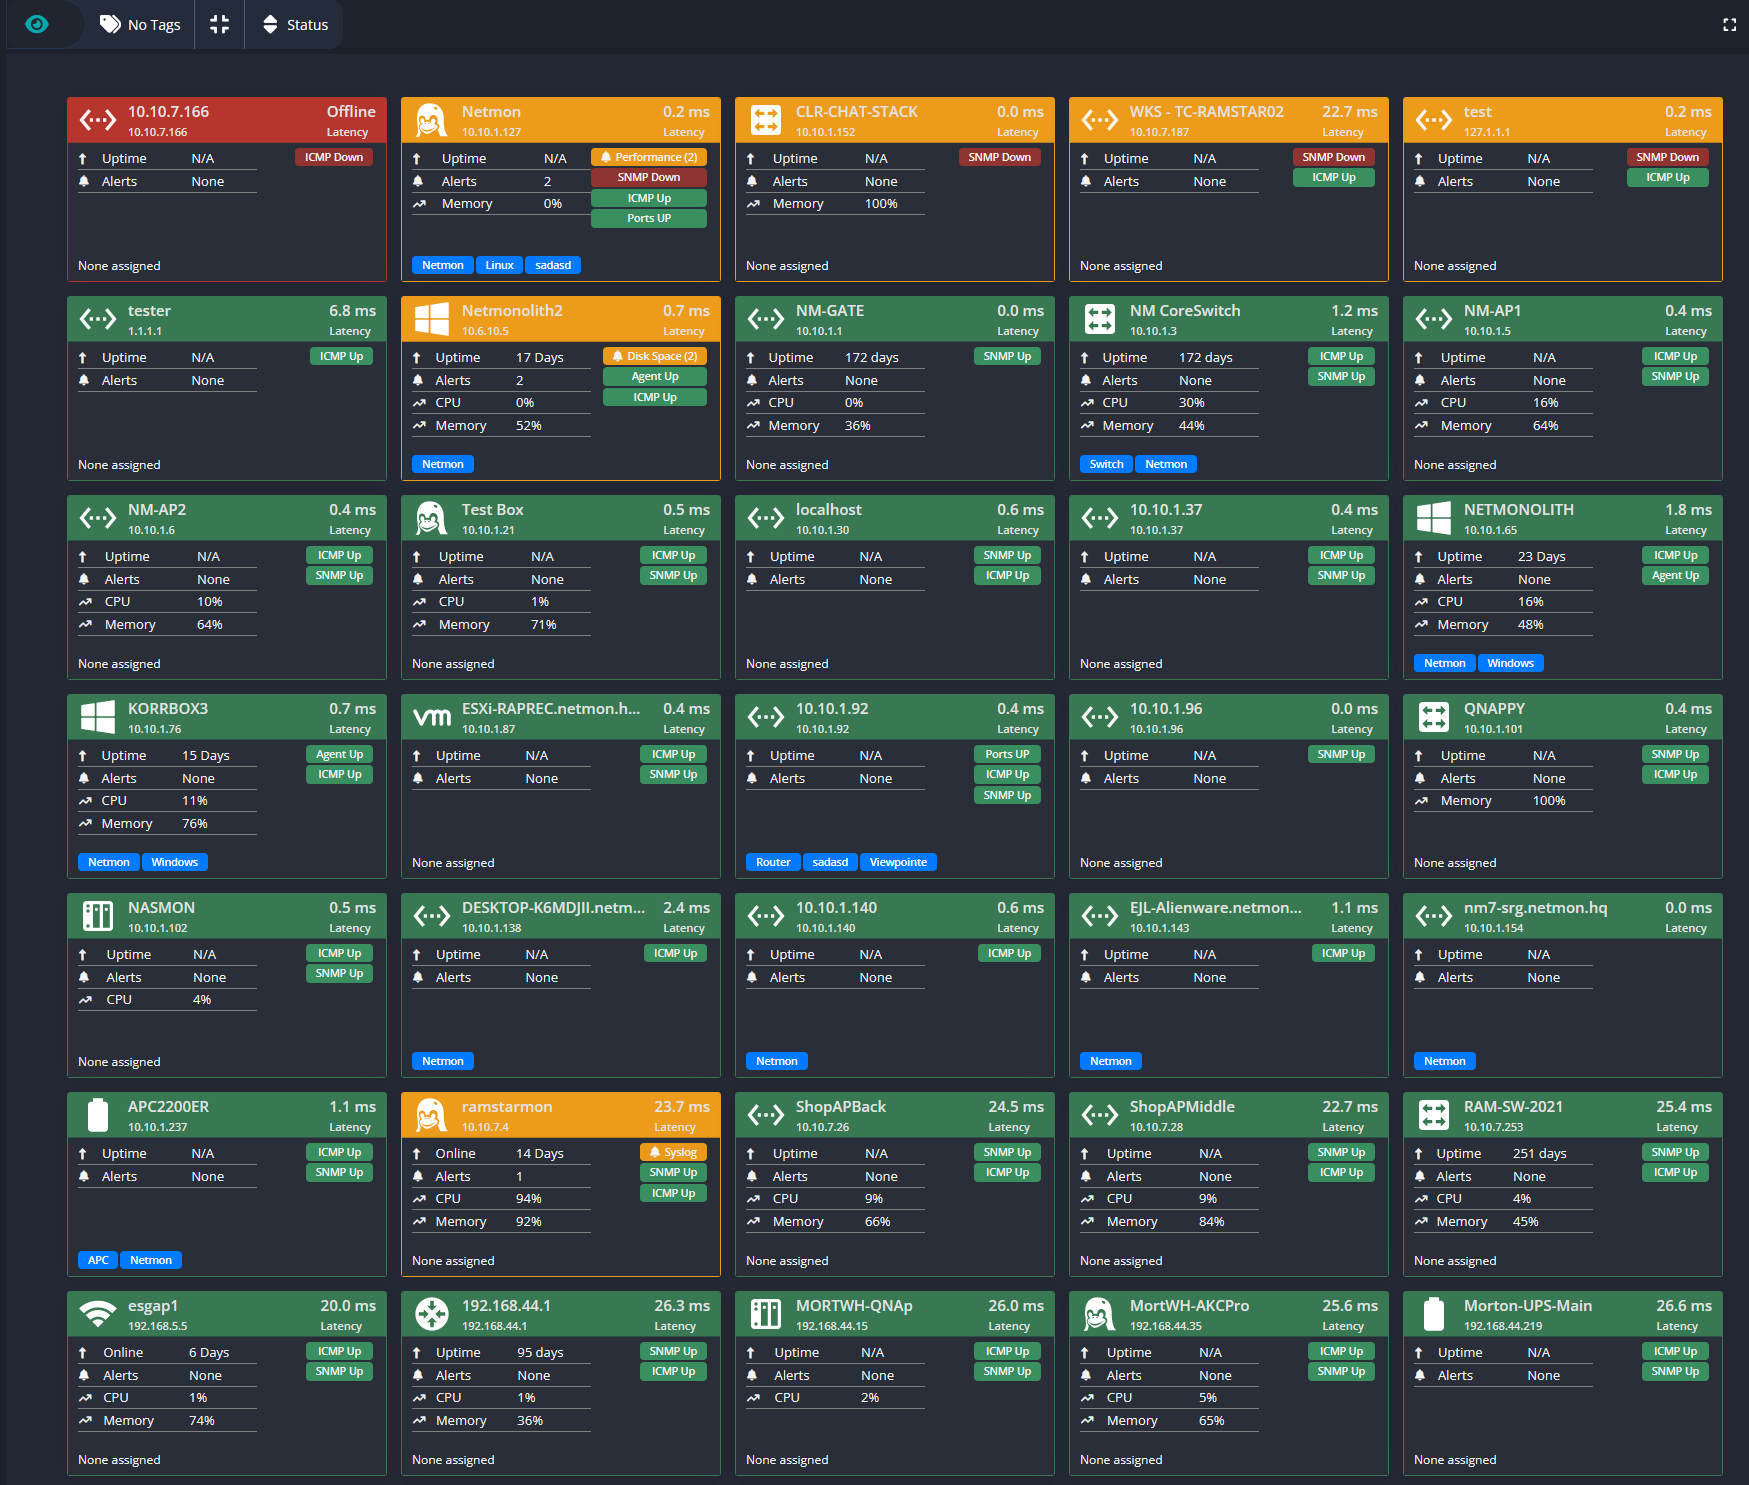
Search
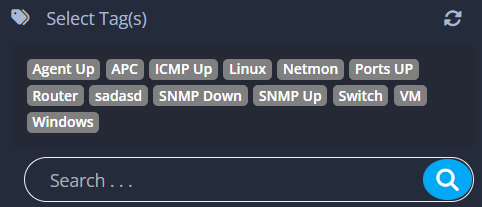
Search via IP or hostname to pull up information of the device(s). In addition, you also have the ability to search by Tags.

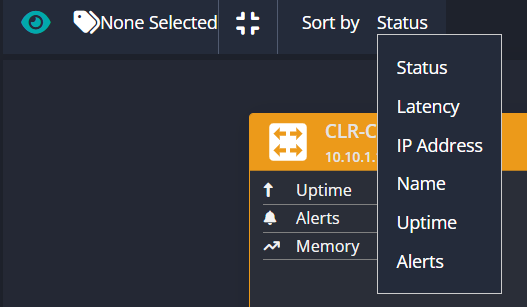
Filters
Additional Filtering can be done to Sort based on device status categories.
Collapsed Mode
Select collapsed mode (blue highlighted icon) to show a condensed display of your devices. (IP address and Hostname). Select it again to show the previous view.
Device Dashboard
Device Dashboards are based on the selected device profile, and any configured trackers.
Most dashboards display Device Information, CPU and RAM donuts, interfaces, and alert history.
They will also load widgets for all configured trackers on that device.
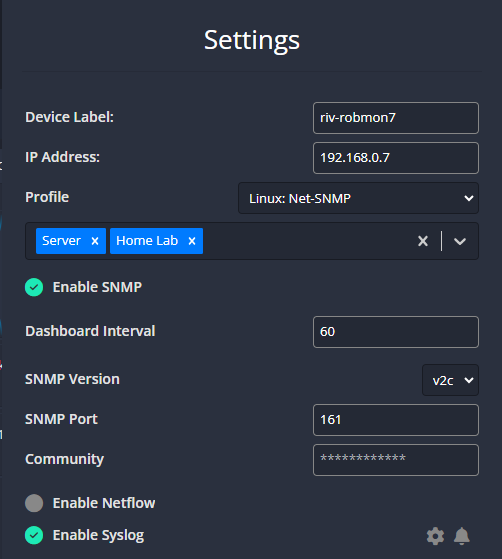
Device Dashboard – Settings
The screenshot below displays the top portion of the settings (of a device that will be pre-configured upon being added in the ‘Device Import’ tab
Here, you have the ability to adjust the hostname, IP address, device profile, tags, allow Syslog and NetFlow.
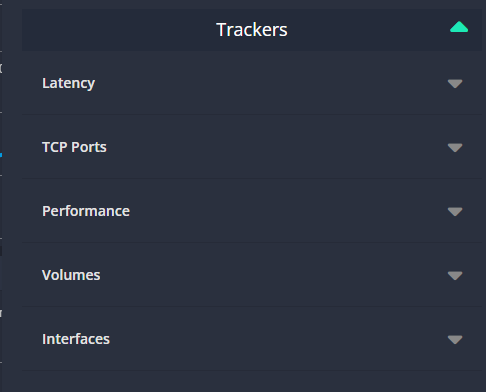
Trackers
In the bottom half of the settings, you can add a variety of trackers: Latency, TCP Ports, Performance, Volumes, Interfaces, Windows Events, and Services
Latency: Add an ICMP Ping tracker to monitor device latency and to determine when a device interface goes up or down and track the duration
TCP Ports: Add TCP tracker to monitor if a TCP port goes up or down
Performance: Monitor performance metrics associated with different MIBS including CPU and RAM memory available/total
Volumes: Add a tracker to monitor disk utilization per disk volume
Interfaces: Monitor bandwidth utilization on a per interface basis
Windows Events: Monitor Windows events
Services: Monitor Windows services to identify when a service goes down
Alerts: You can select the arrow next to Alerts to display all the alerts you have created for this device.
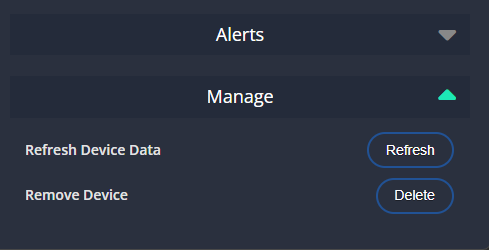
Manage: Refresh Device Data button will refresh the device data
Remove Device: The ‘Delete’ button will delete the device
How to Add a Tracker
This example below displays a Windows Server dashboard settings.
*Note*: Interval is in seconds
- Select the drop down for Volumes
- Select the checkbox (circle) next to the disk you want monitored
- Select the gear to configure
- Select the Bell Icon to assign an alert
- Select Add Alert button
- The Alert label is automatically generated (editable)
- Select trigger to alert when above 80% (your preference)
- Select the gear for optional settings
- Select the email recipient
- Done; now you will receive an email if the disk utilization exceeds above 80%.
- To delete the alert, select the ‘Trash Bin’ icon twice
*Note*, the Calendar icon can be used to configure scheduled outages.
Device Import & Discovery
Automatically Discover Devices
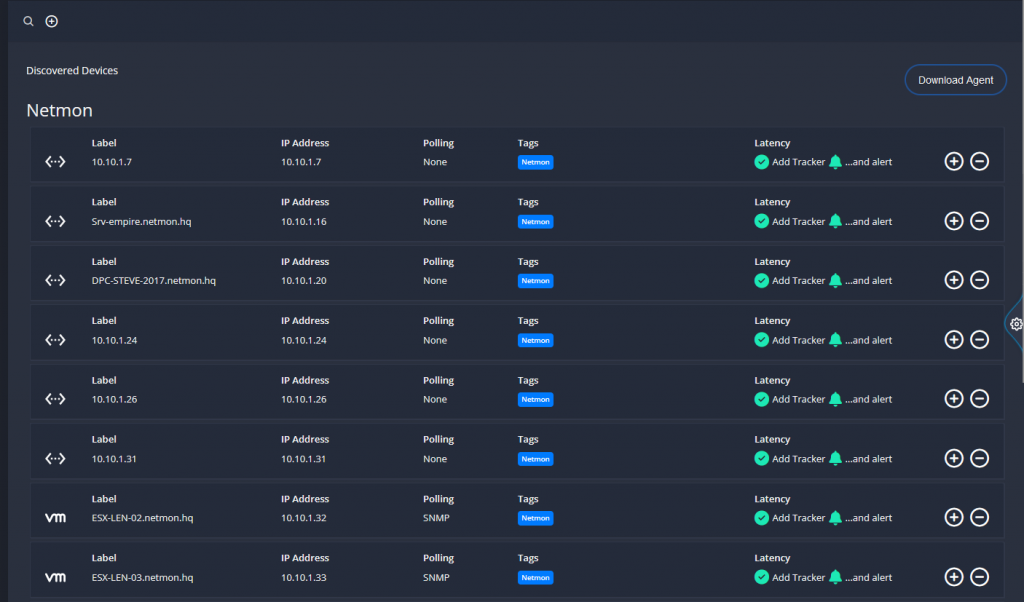
To automatically discover devices first open up the ‘Monitored Network and Credential Settings’ by selecting the gear on the right side as seen in the above image.
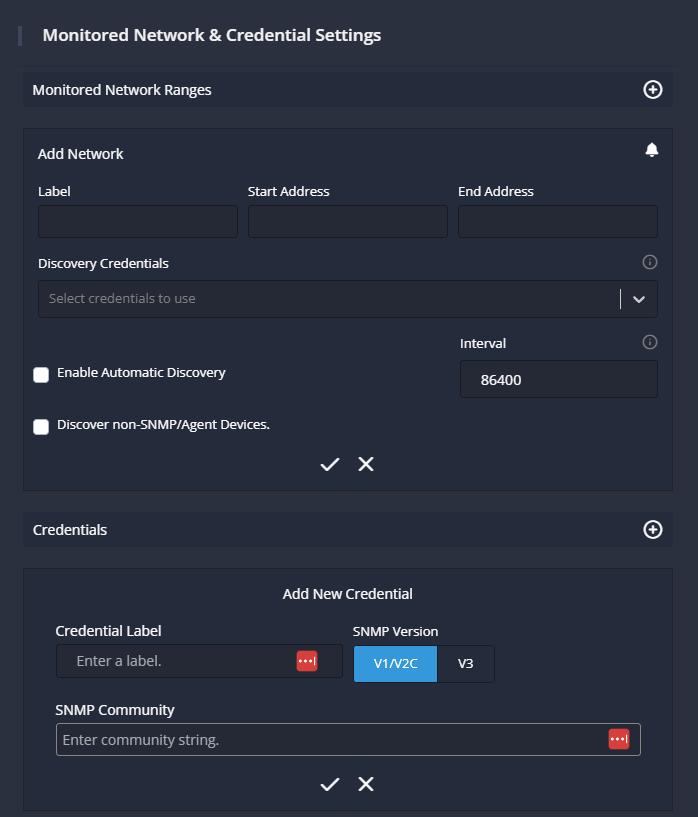
- Credentials: Enter a Label and select SNMPv1/v2c or v3 or Agent
- Fill out your SNMP string
- Select the checkmark to save your newly created credentials
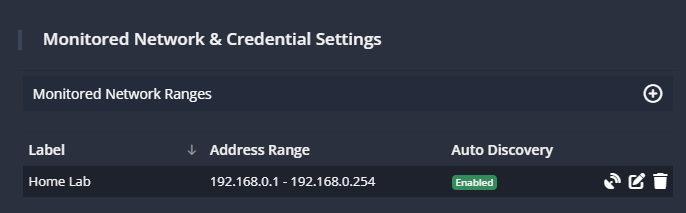
- Scroll up to Network Monitor Range
- Label your Network range, enter a start address (Ex. 192.168.0.1) and the end address (Ex. 192.168.0.254)
- Discovery Credentials: Select your newly created credentials from the drop down list
- Check the box to enable Automatic Discovery
- * additionally, you can select the Discover Non-SNMP/Agent Devices option to discover all hosts which respond only to ping.
- To set up an agent device, simply download the agent and install on your Windows machines
Then scan the network by selecting the ‘satellite’ button to scan the network range you just added
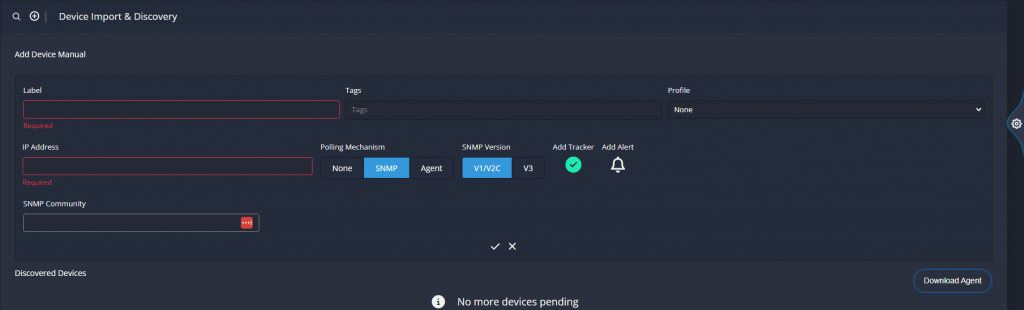
Manually Add a Single Device
- Click the + button
- Fill out ‘Label’ (typically the host-name of the device)
- Fill out the IP address of the device
- ‘Tag’ field: Assign any existing tags, or create your own.
- Select a device ‘Profile’ which best matches your device.
- Select the polling mechanism: None, SNMP or Agent (You can download the free agent from the ‘Download Agent’ button that will be located at the right hand corner)
- Select the ‘Add Tracker’ to begin monitoring Ping on this device.
- Select the ‘Bell’ icon button to also add an alert.
- Select the ‘check mark’ to save or ‘x’ to discard
Visual Network Explorer
Overview
The visual network explorer is a live visual representation of network activity / communication in your environment.
You can choose to view live information or go back in increments of 5 minutes (up to 30) to view historical data
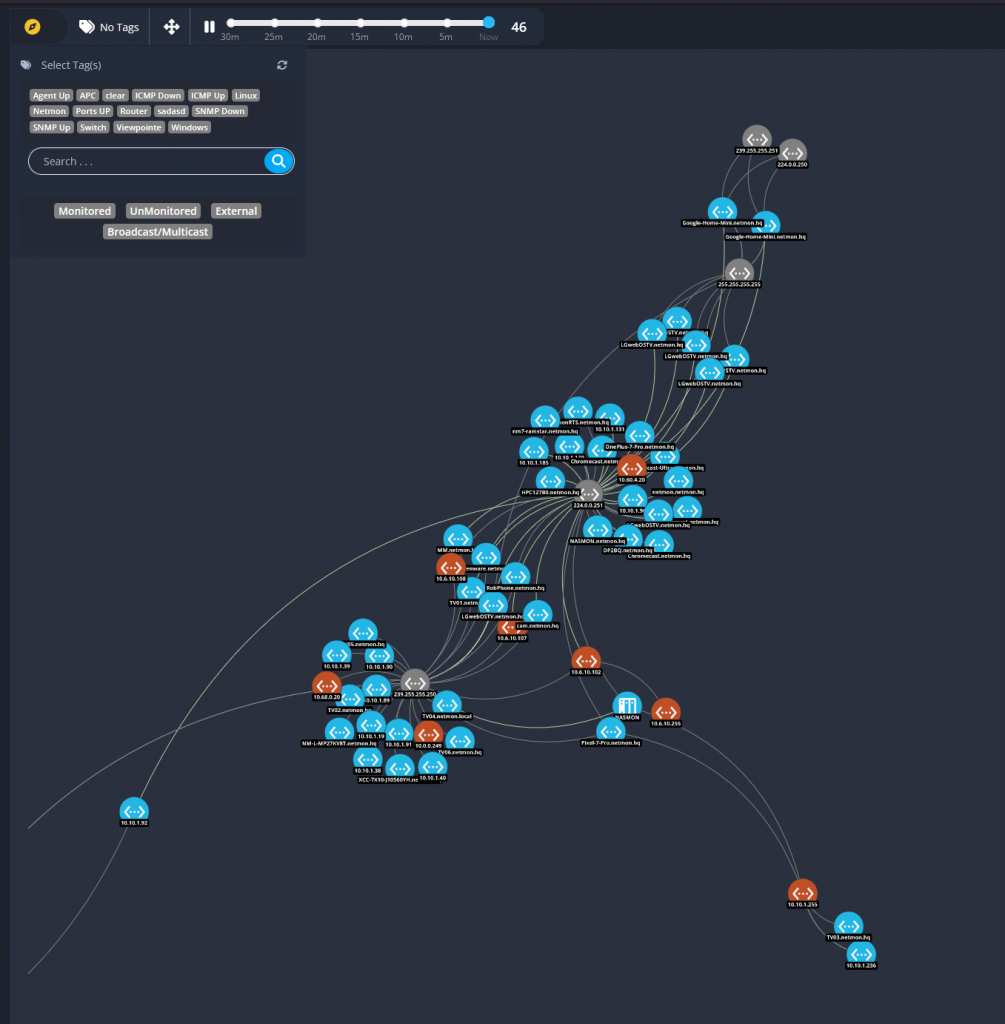
Filters & Options:
Selecting tags or entering the name or IP of a monitored device in the Search will have the result of filtering out conversations with which one node does not match.
- Monitored – Remove nodes where one member of the conversation is not a member of Monitored Networks from Device Import.
- Unmonitored – Removes nodes where one member is not a member of the private IP namespace (10.X, 192.168.X) which is not being monitored.
- External – IP Addresses which are not monitored or part of the private name space.
- Broadcast/Multicast – Attempt to filter conversations where one member is a multi/broadcast address.
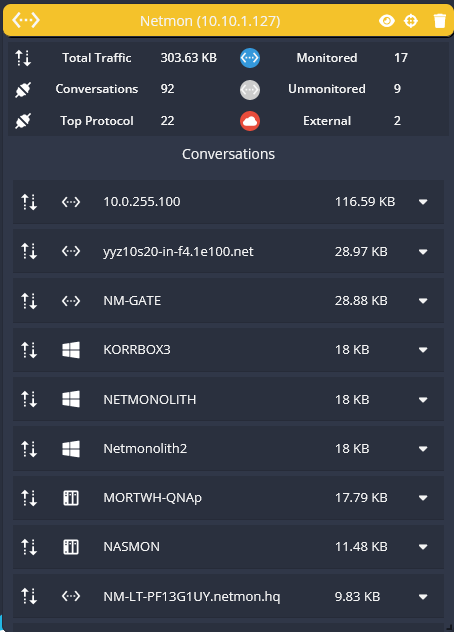
Focusing:
Clicking on a node will bring it into focus and open the
Node Conversations Card.
You may have several Node Conversation Cards open at once
The ‘Selected’ node will appear in gold.
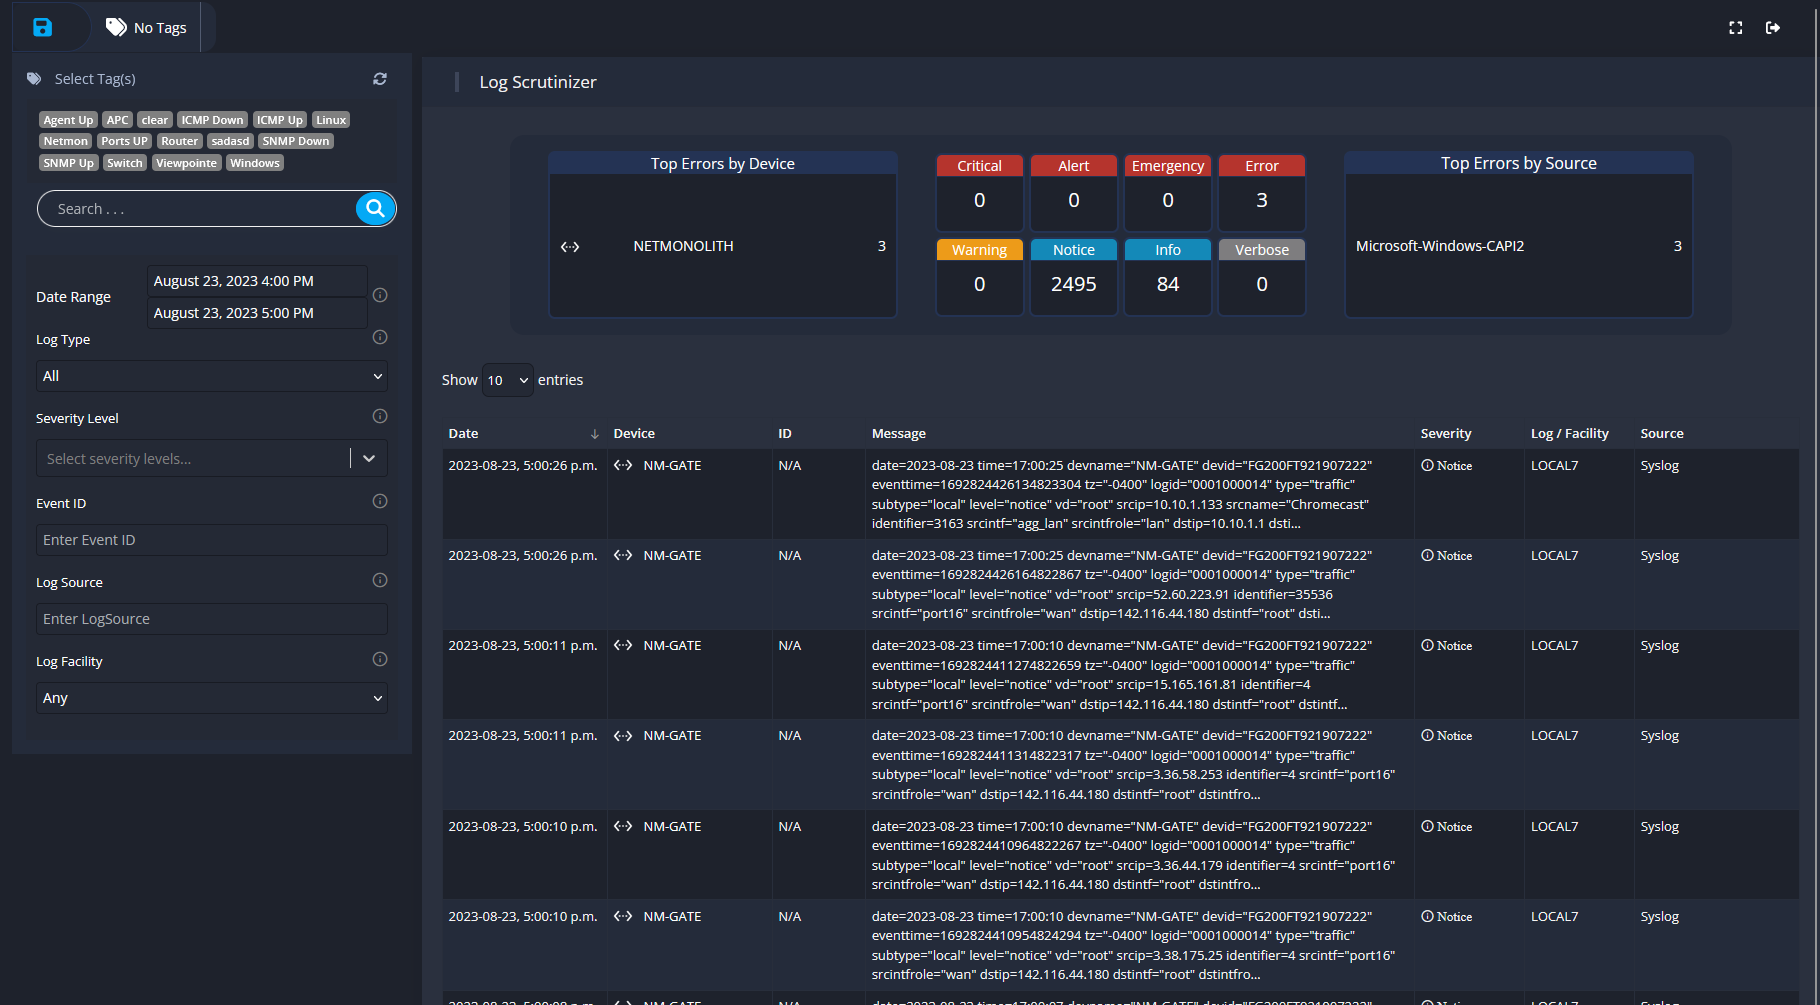
Log Scrutineer
The Log Scrutineer is the Netmon 7.0 Syslog and Eventlog aggregator, where all logs come together in one place for your review.
Top Errors by Device: Displays the top errors via host-name
Top Errors by Source: Displays the top errors via source
By clicking no the filter button, you can apply filters to narrow down your search results:
Date Range, Log Type, Severity Level, Event ID, Device Name, Log Source, Log Facility
Alert Centre
Alert Manager
The Alert Centre is where the alerts are managed.
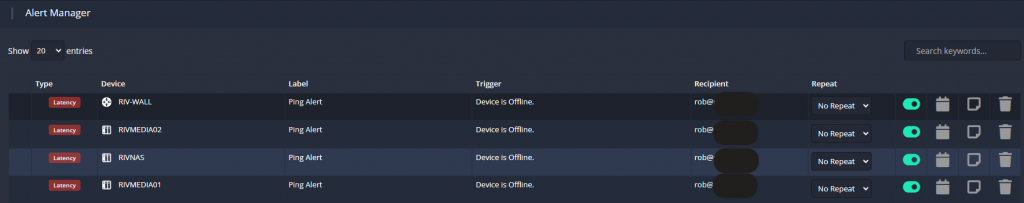
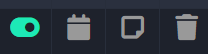
You can toggle the alerts to be disabled or enabled by clicking on the green toggle switch.
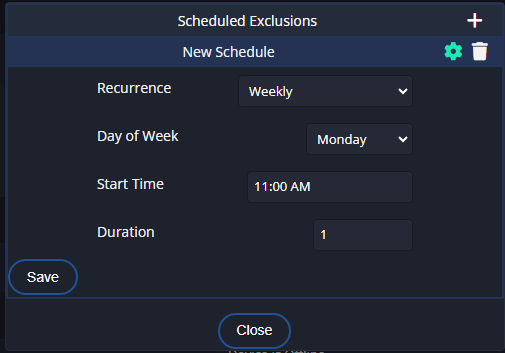
With the Calendar icon button, you can select this, to set up scheduled exclusions (such as needing to disable alerts for a maintenance window)
This allows you to set: Recurrence, Day of Week, Start Time, and Duration (time is in hours)
The sticky note icon button is for any notes you might want to include attached to the alerts.
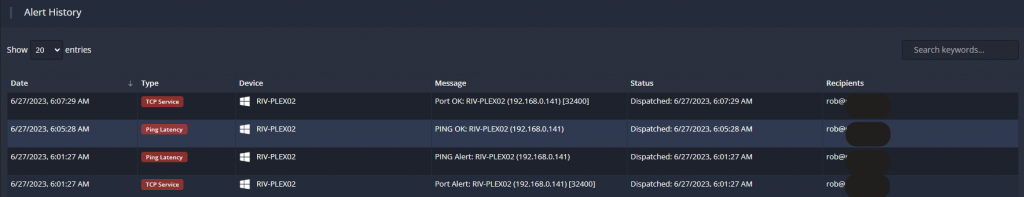
Alert History
This provides an overview of recent and past alerts.
This will tell you the date and time, Type of Alert, which Device, the message sent via email, Status and the recipient as to who received the alerts.
Reports
If you select the gear on the right, it will give you a summary list of reports you have created.
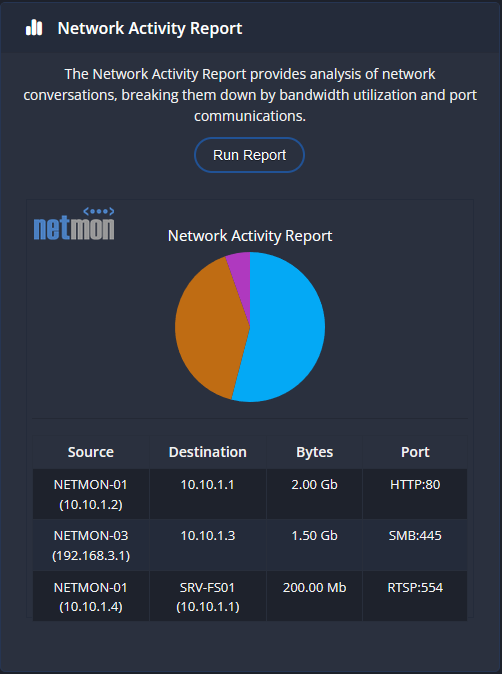
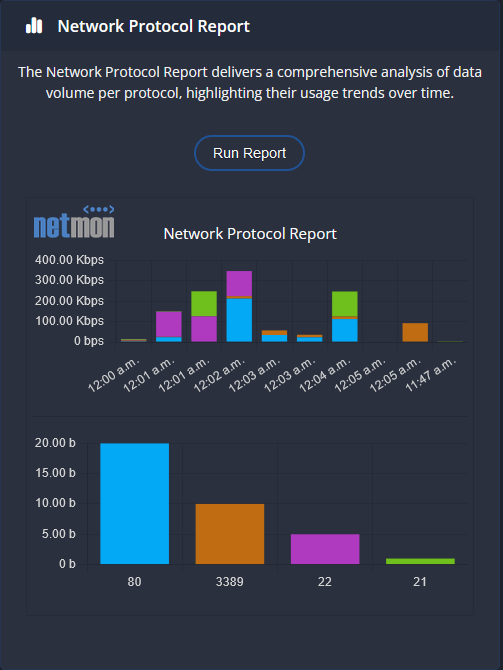
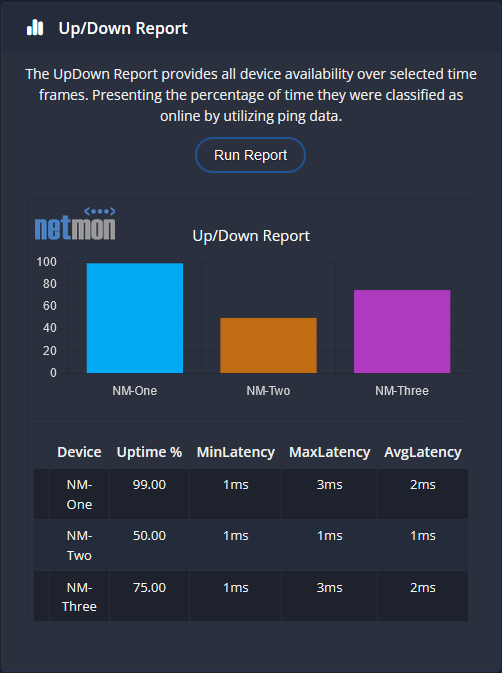
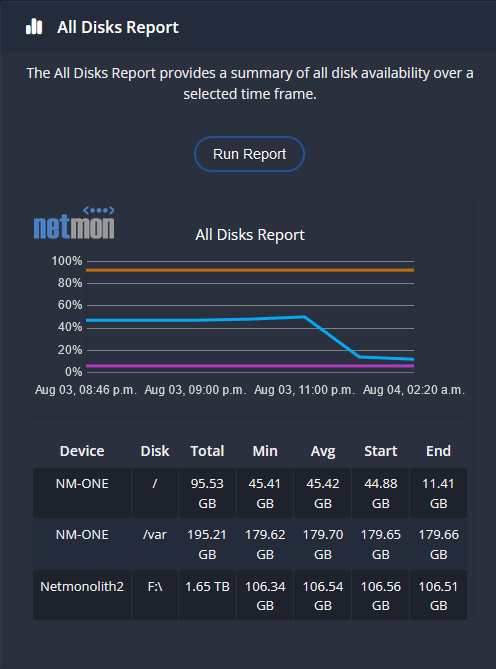
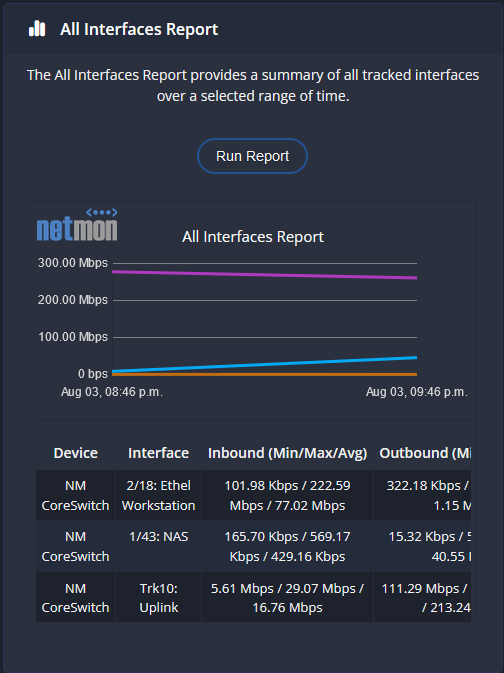
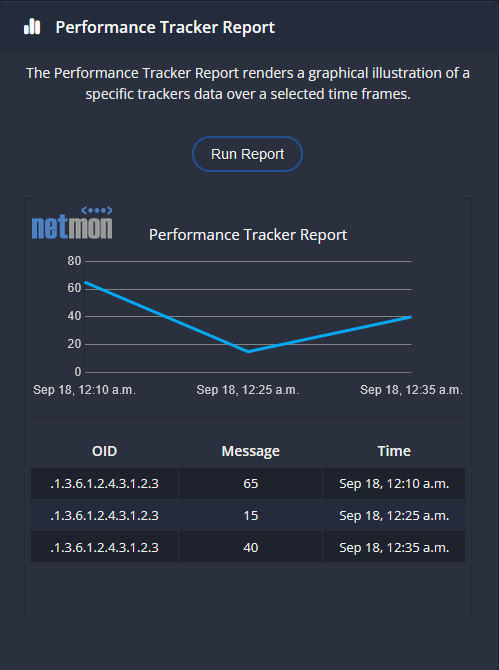
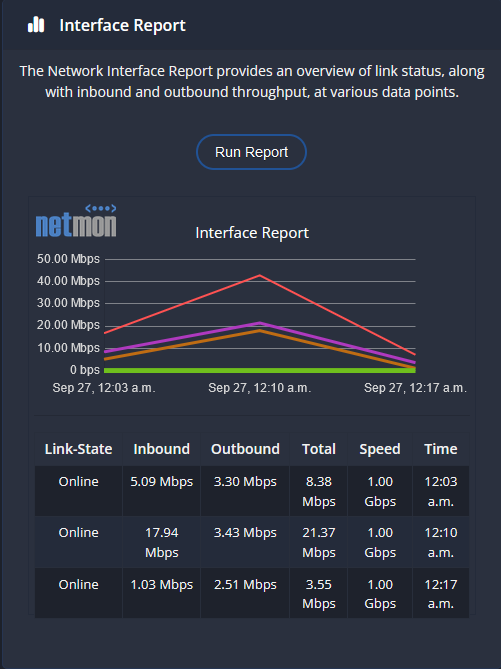
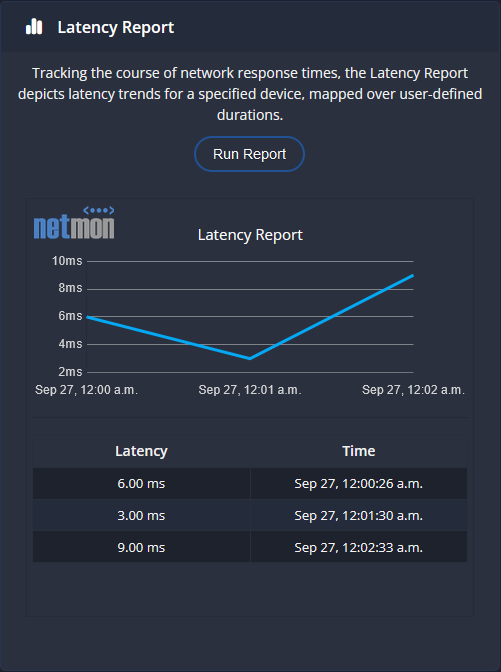
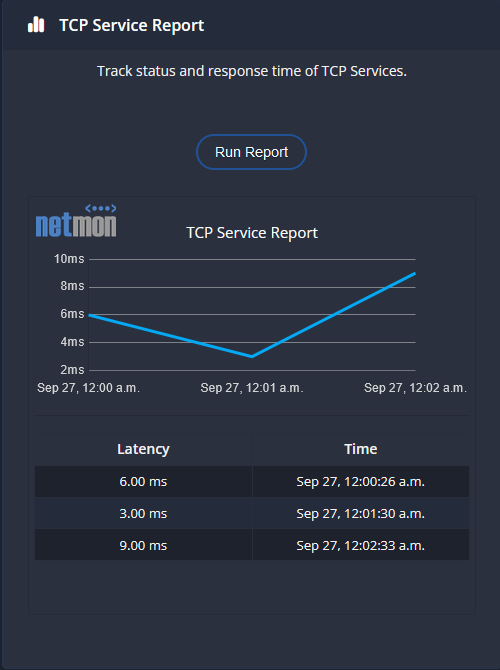
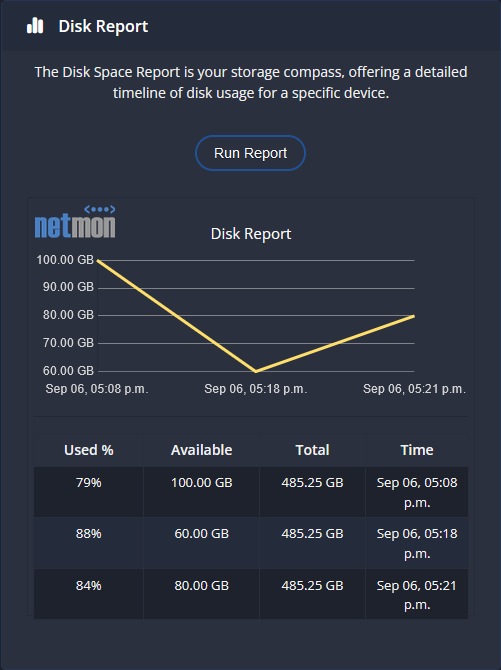
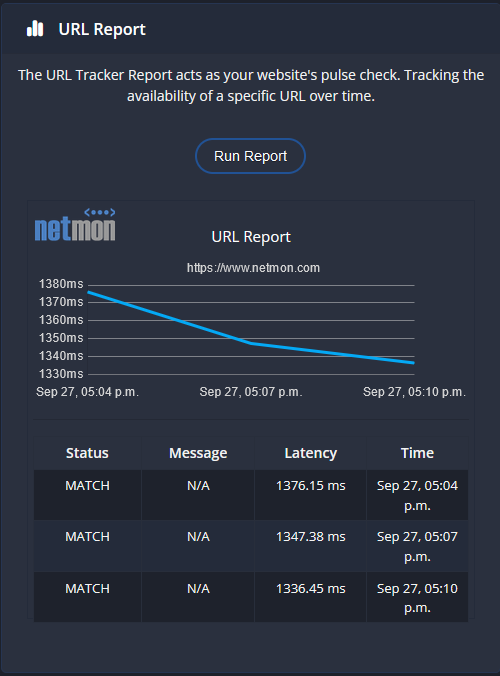
Report Manager
URL Trackers
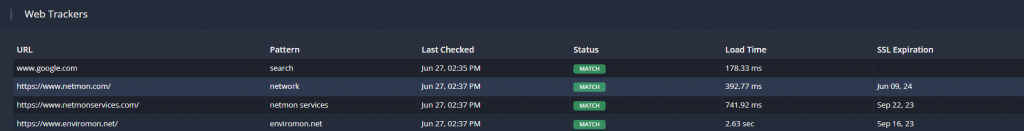
URL trackers can track and alert you when a website or URL goes down or is unreachable. It can also show the SSL expiration date and load time of the website if applicable.
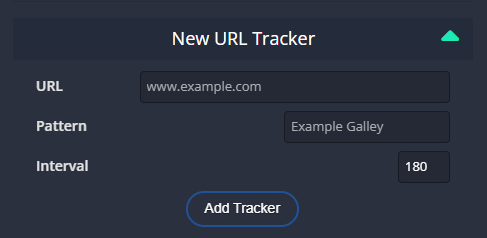
To create a new web tracker, select the gear on the right to pop out the settings and select ‘New URL Tracker’ which will drop below the “configure” settings:
- – Enter your URL (example: https://www.netmon.com)
- – Pattern; you can enter any text that is visible on the web page (example for Netmon.com we utilize the keyword “network”
- – Polling Interval is in seconds
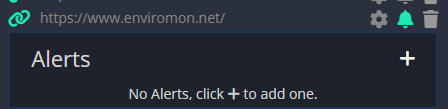
To create an alert for the web tracker; select the ‘Bell’ icon button and then click the + button to create an alert, select the ‘Trash Can’ to delete the tracker.
Network Tools
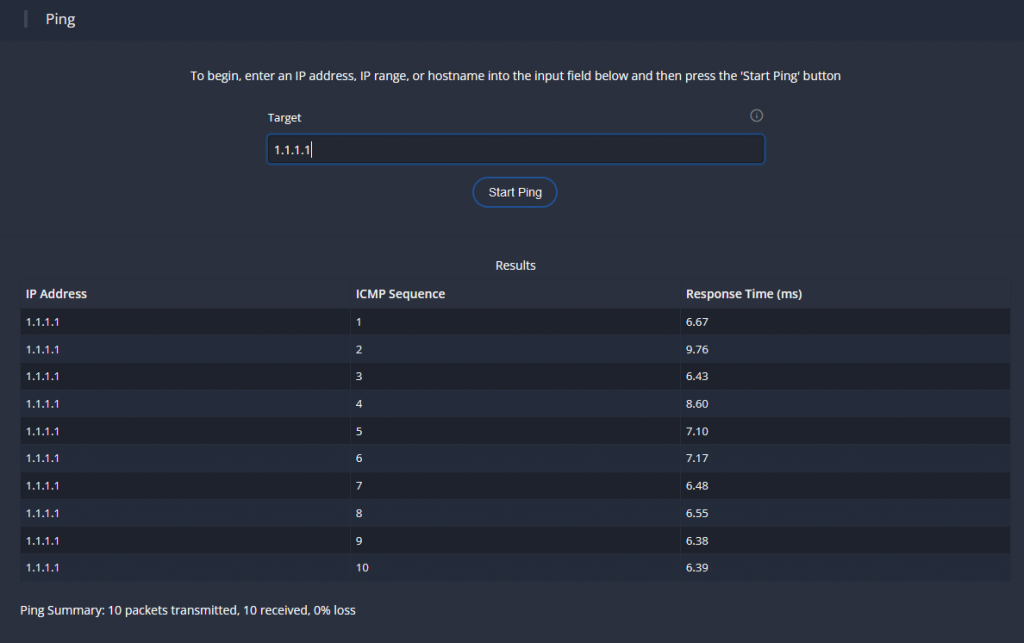
Ping a target and report the results.
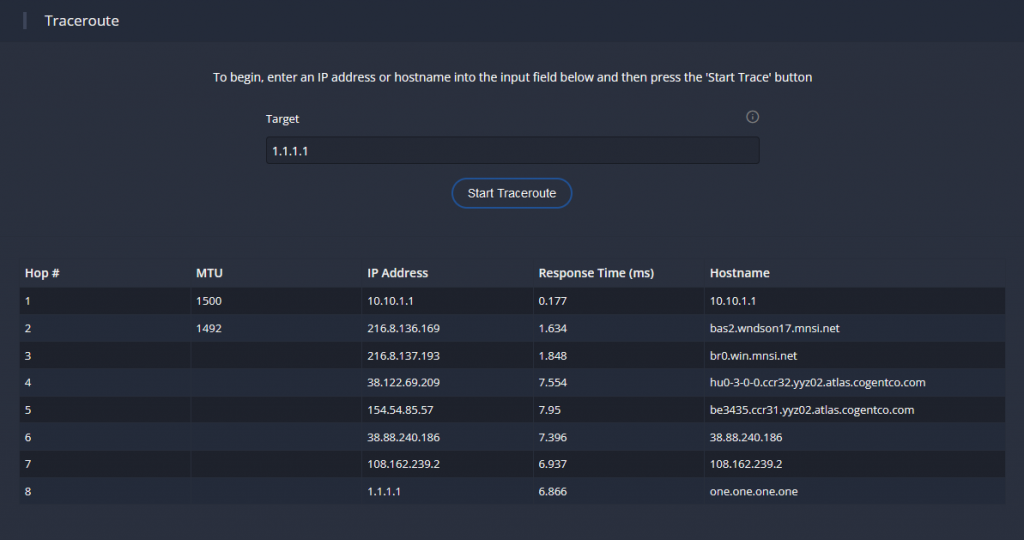
Discover the path and MTU to a target.
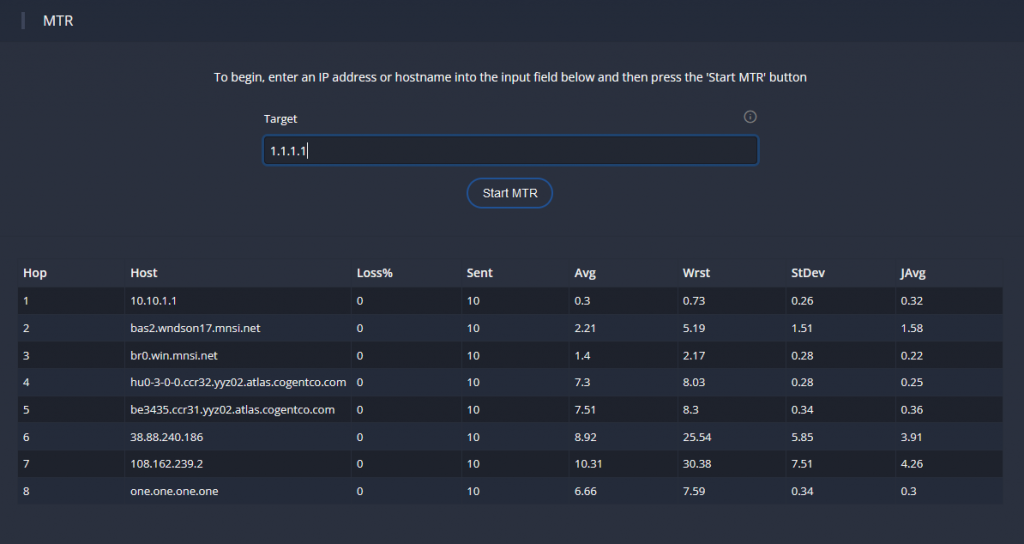
Perform path and jitter/loss discovery.
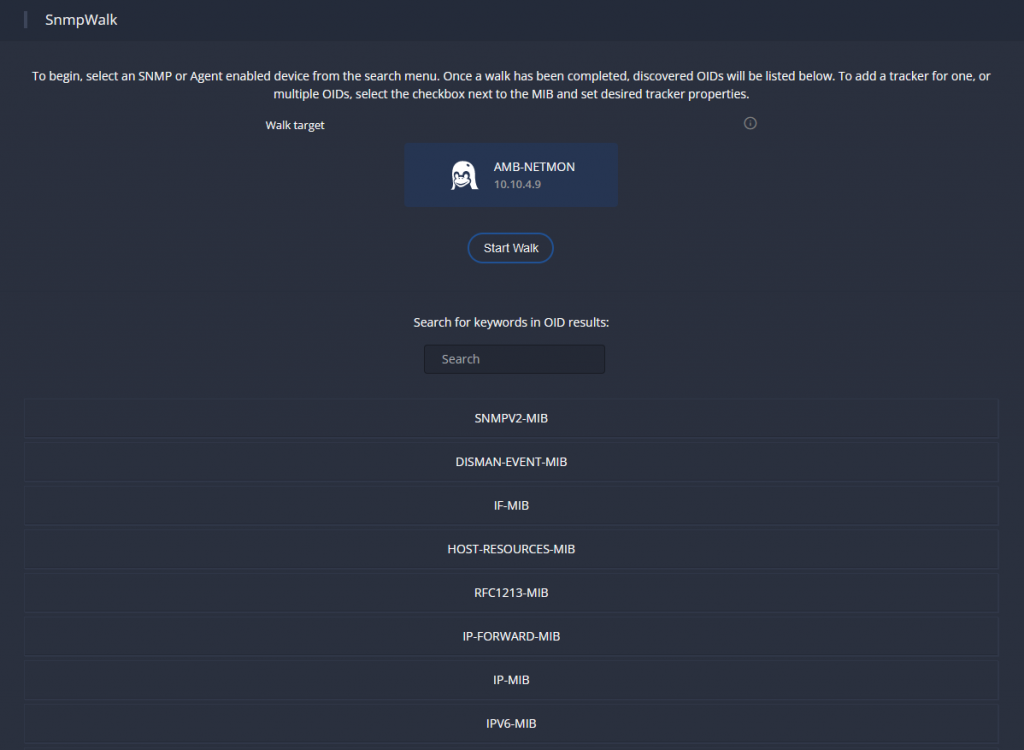
Walk a device for track-able data
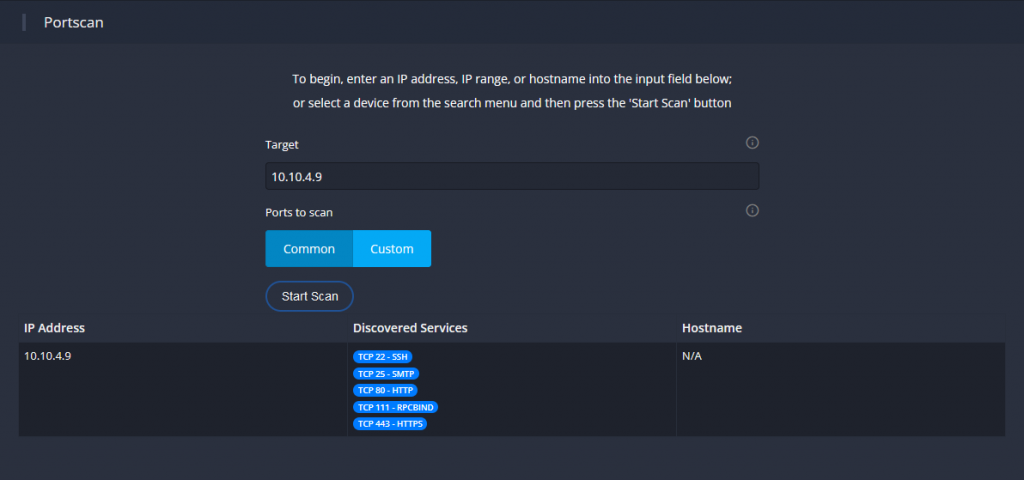
Perform a port scan
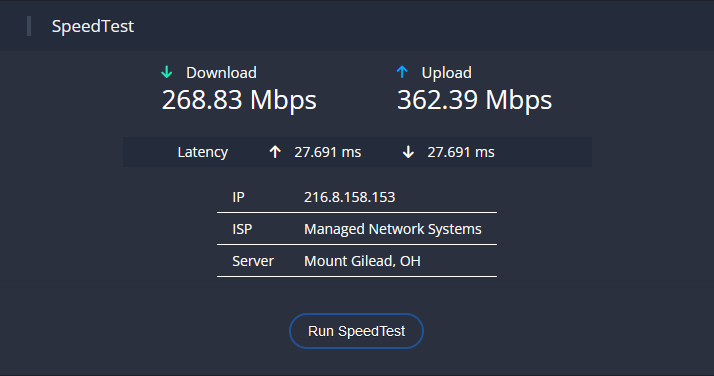
Determine Netmon’s speed to the internet.
System
System Settings
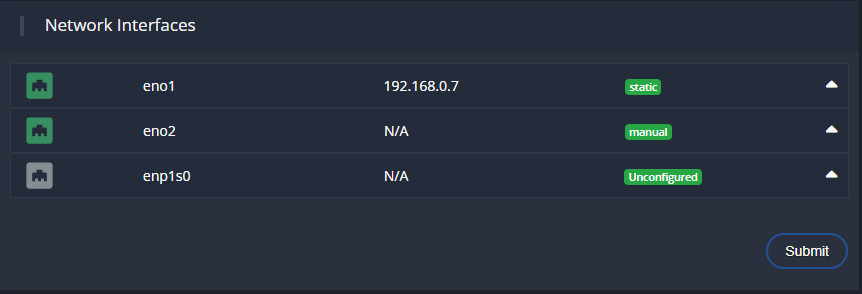
Netmon will show all interfaces as unconfigured. Configure the interface you’re already on as static otherwise it might not have network access after you reboot.
Then select the interface that you will assign to be the Sniffer (manual) and select submit.
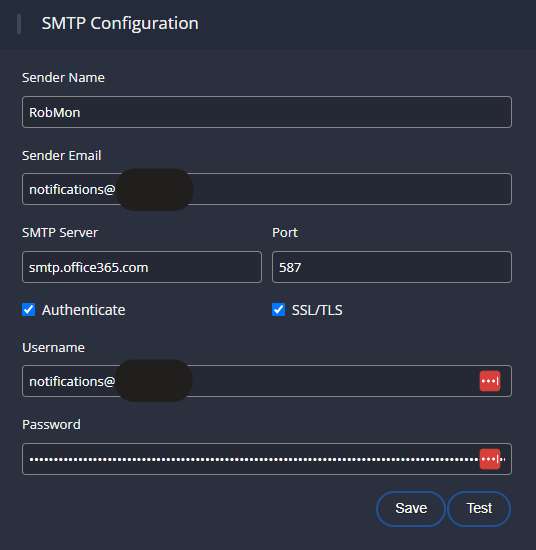
This section is where you configure SMTP Server settings
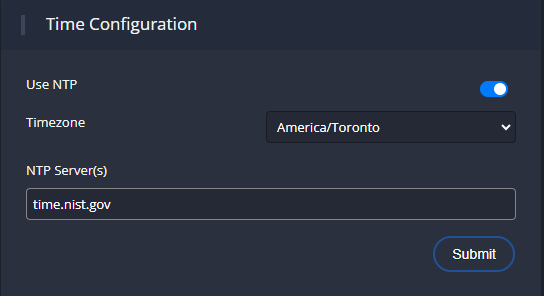
The Time configuration is where you configure NTP Server (s) settings
Users and Permissions
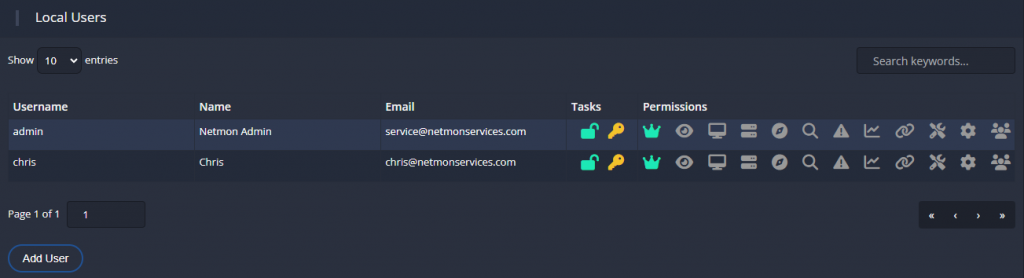
- Change default user email to your email address (this is used for receiving alerts and signing into your Netmon 7.0
- You can select ‘Add User’ to add any additional users with selected/limited permissions
- Under tasks, select the lock to lockout an account (select again to unlock the account)
- Select the key to change your password
Permissions:
- Crown: Unrestricted Access
- Eye: Can access Overwatch
- Monitor: Can Access Device dashboard
- Device: Can make changes to devices
- Compass: Access visual network explorer
- Eye Glass: Can access eventlog/syslog data
- Triangle/Exclamation Mark: Manage alerts in alert center
- Graph: Can access and run reports
- Paperclips: Can manage URL trackers
- Tools: Can access Network Tools
- Gear: Can manage system settings such as network interfaces, time, and data retention
- People: Can manage users and permissions
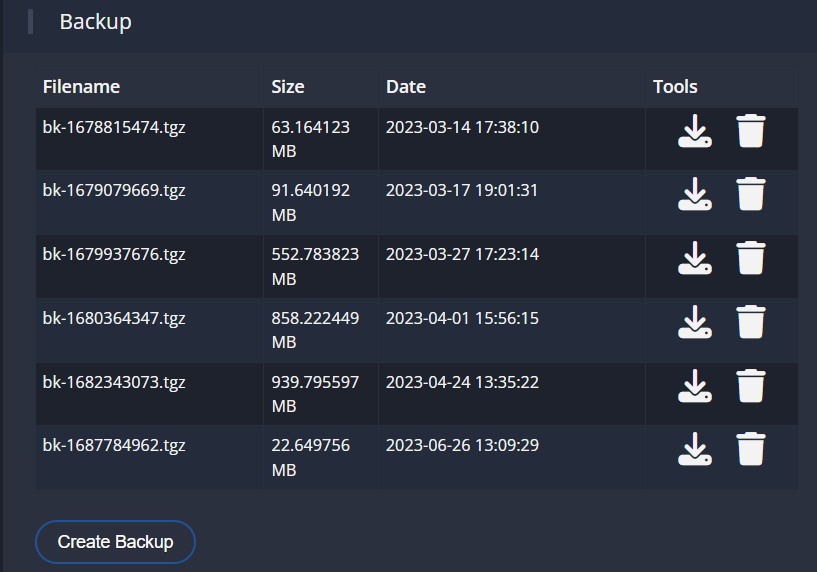
Backup:
This section is where you can create and access backups for download and deletion
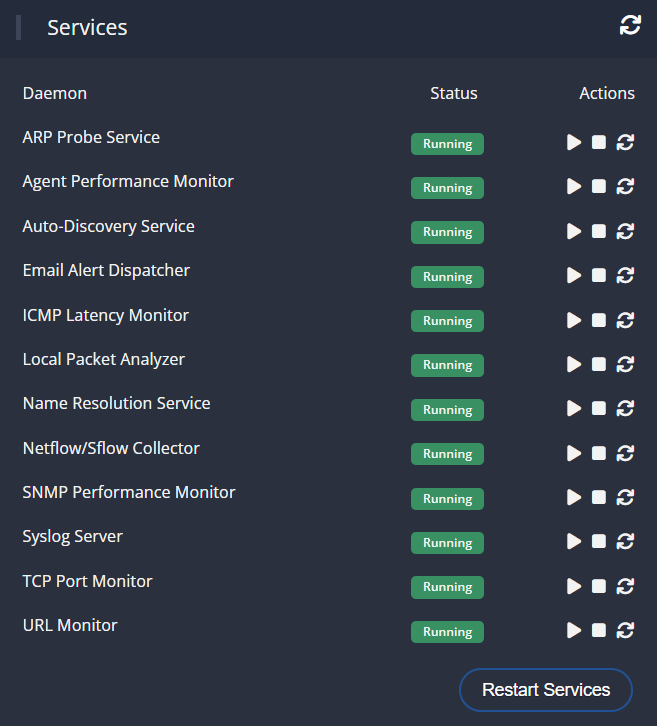
Services:
This section is where you can view and restart the Netmon appliance daemons and services
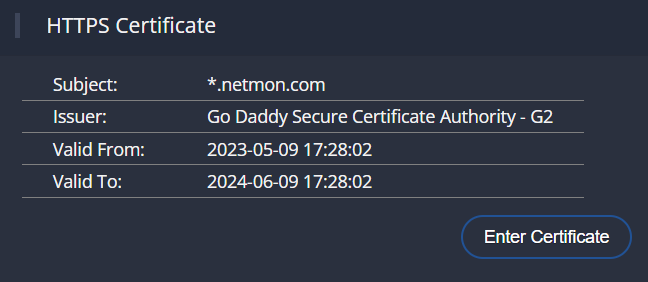
HTTPS Certificate:
This section is where you can upload or enter an SSL certicate
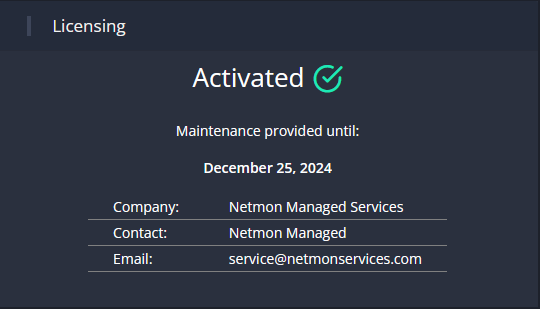
Licensing:
This section displays the current licensing/activation status. There is nothing to configure here as it is for informational purposes only.
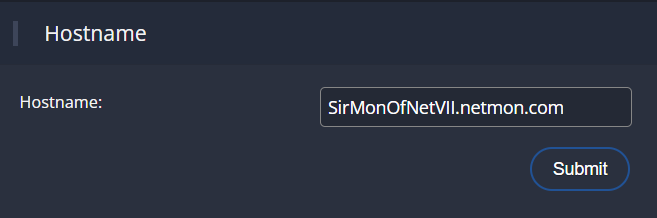
Hostname:
This section allows you to change the Hostname of the Netmon appliance
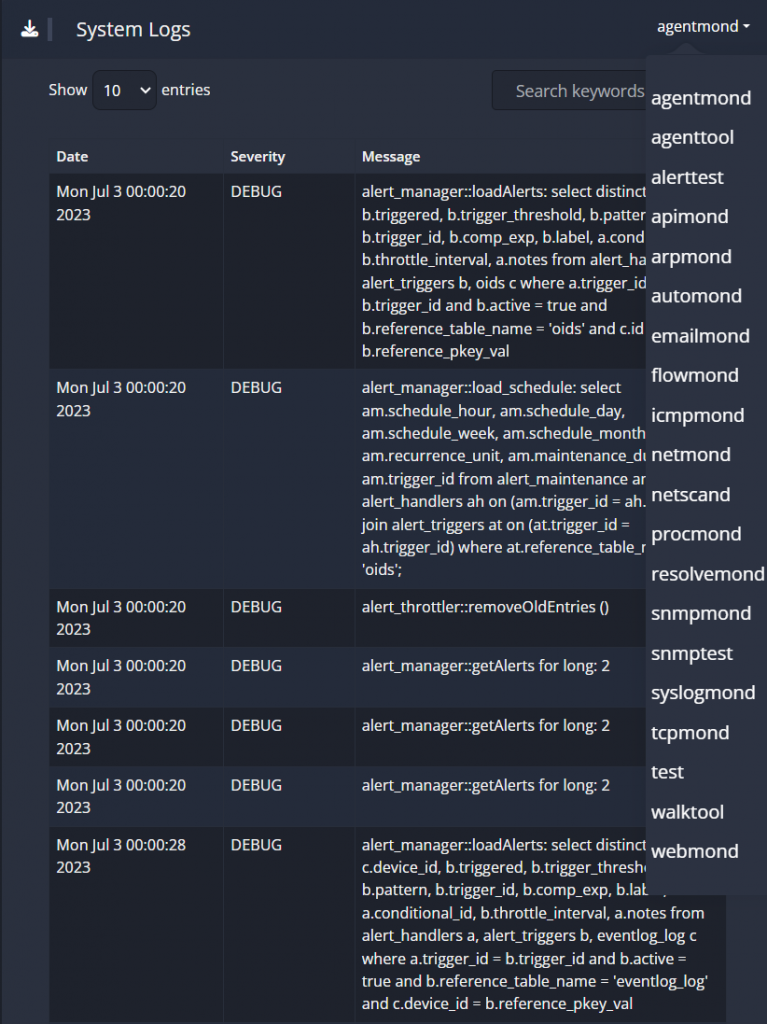
System Logs:
This section provides the system logs of the Netmon appliance (typically used for support/troubleshooting of the apliance server). This has access to different log files (see screenshot below):