Self-hosted appliance

Netmon is your all-in-one network monitor

Your network already tells you everything — in metrics, in traffic, in logs, in packets. Netmon is the appliance that listens to all of it at once, from inside your rack, so the whole story of your network lives on one screen that you own. No cloud tenant. No per-device license fees.

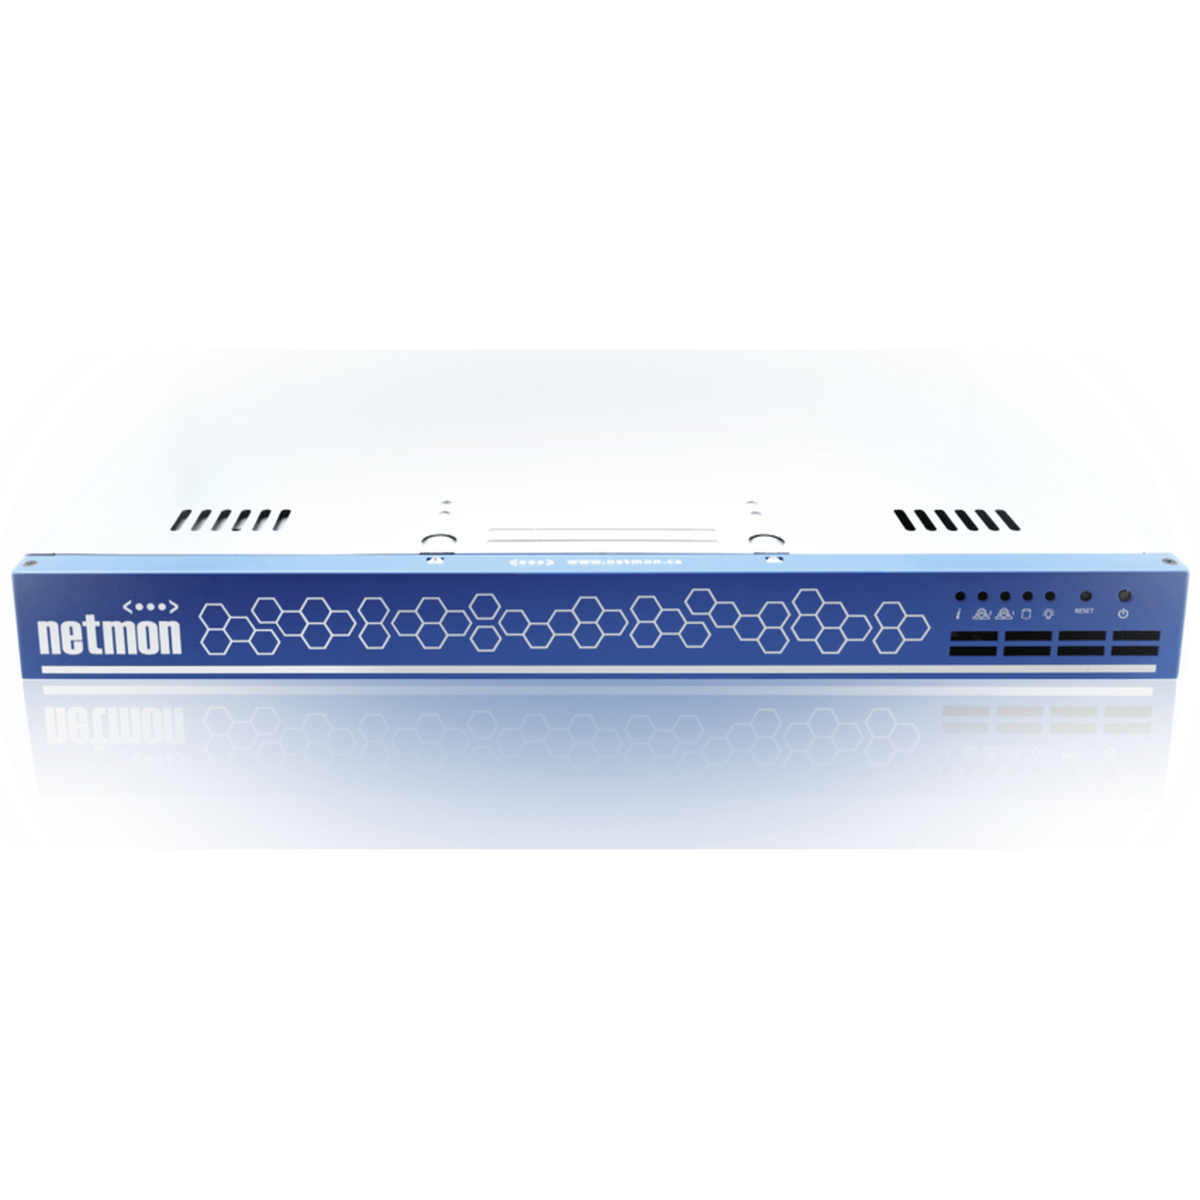
The Netmon Enterprise appliance — a 1U rack-mount unit with a blue front bezel

The Monday call says the network is slow. Across four separate tools, that is an hour of tab-hopping before you even know where to look. On Netmon it is one walk down the page: Overwatch shows you which device went red, and when. Its dashboard shows the interface that saturated. The traffic map shows who was talking to it — including the conversation that should not have been there. The logs show what the switch said about it at 2:11 in the morning. And when someone upstream insists everything looks fine on their end, you pull the packets — filtered from the stream the appliance was already watching — and open them in Wireshark.

That is the whole idea of Netmon: not five tools that happen to share a login, but one system where every view is a different window on the same minute of your network’s life.

Built for the Morning Something Breaks

Overwatch

Your Whole Fleet on One Screen

Device Overwatch is the screen you leave up all day, because it answers the question you care about most before you have had to go looking for it: is anything broken right now?

  • Every monitored device gets a live tile showing latency, uptime and the state of each check — ICMP, SNMP and agent — and you can sort or filter the whole wall by status or by tag when you only want to look at the branch offices.
  • A device is marked down only when two independent signals agree on it, so the switch you added ten seconds ago never pages anybody at three in the morning.
  • If all somebody needs is the wall, you can give them an account that sees nothing else — which is exactly what you want running on the NOC display in the hallway.
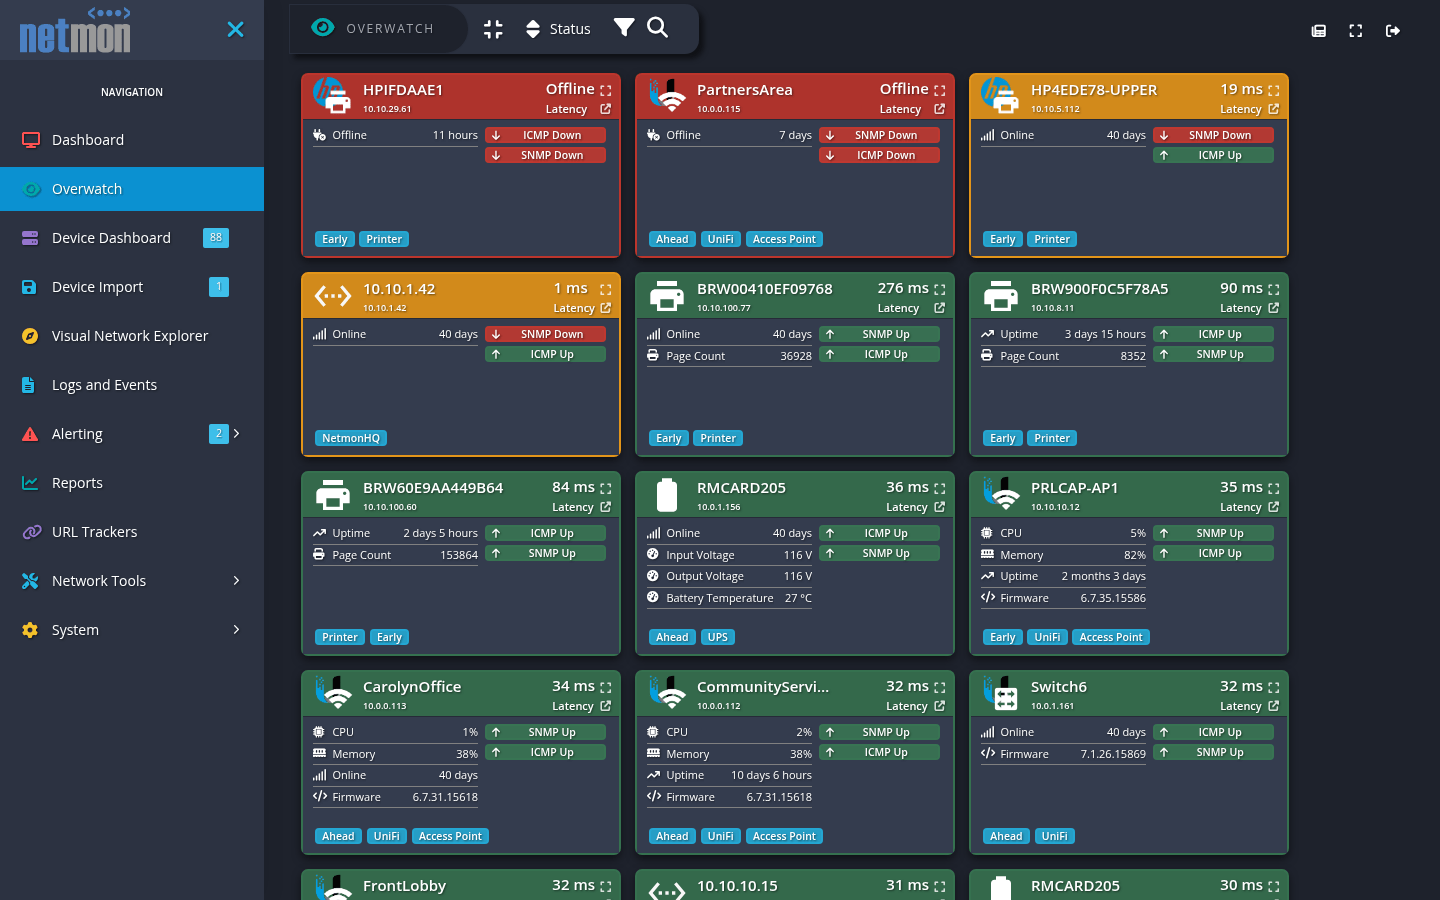
Netmon Overwatch — fleet status wall showing every monitored device with latency, uptime and per-check state
SNMP & agent monitoring

Metrics From Everything You Already Own

Add a switch and it arrives with its interface graphs already drawn instead of a blank page waiting to be configured — over 35 built-in device profiles know which sensors are worth watching on that kind of equipment and pick them for you.

  • Those profiles span more than 25 vendor families — Cisco, HPE, Aruba, Juniper, Fortinet, SonicWall, WatchGuard, Ubiquiti, VMware ESXi, Synology, QNAP, UPS units, printers and environmental probes — and 48 MIB files ship on the appliance. SNMPv1, v2c and v3 are all supported, with v3 authentication up to HMAC-SHA-512 and privacy up to AES-256.
  • Where SNMP runs out of road, the Windows agent gives your servers real monitoring: services, processes, event logs, installed software, hardware inventory, and a browsable view of what is actually filling a drive — with no SNMP on the host. It enrolls with a one-time adoption key even behind NAT, one agent can report to several appliances, and the service never installs software by itself.
  • Discovery scans only the ranges you declare and queues whatever it finds on the Device Import page for a person to approve. Nothing is monitored until an operator says so, so a discovery sweep never turns into a hundred devices you did not ask for.
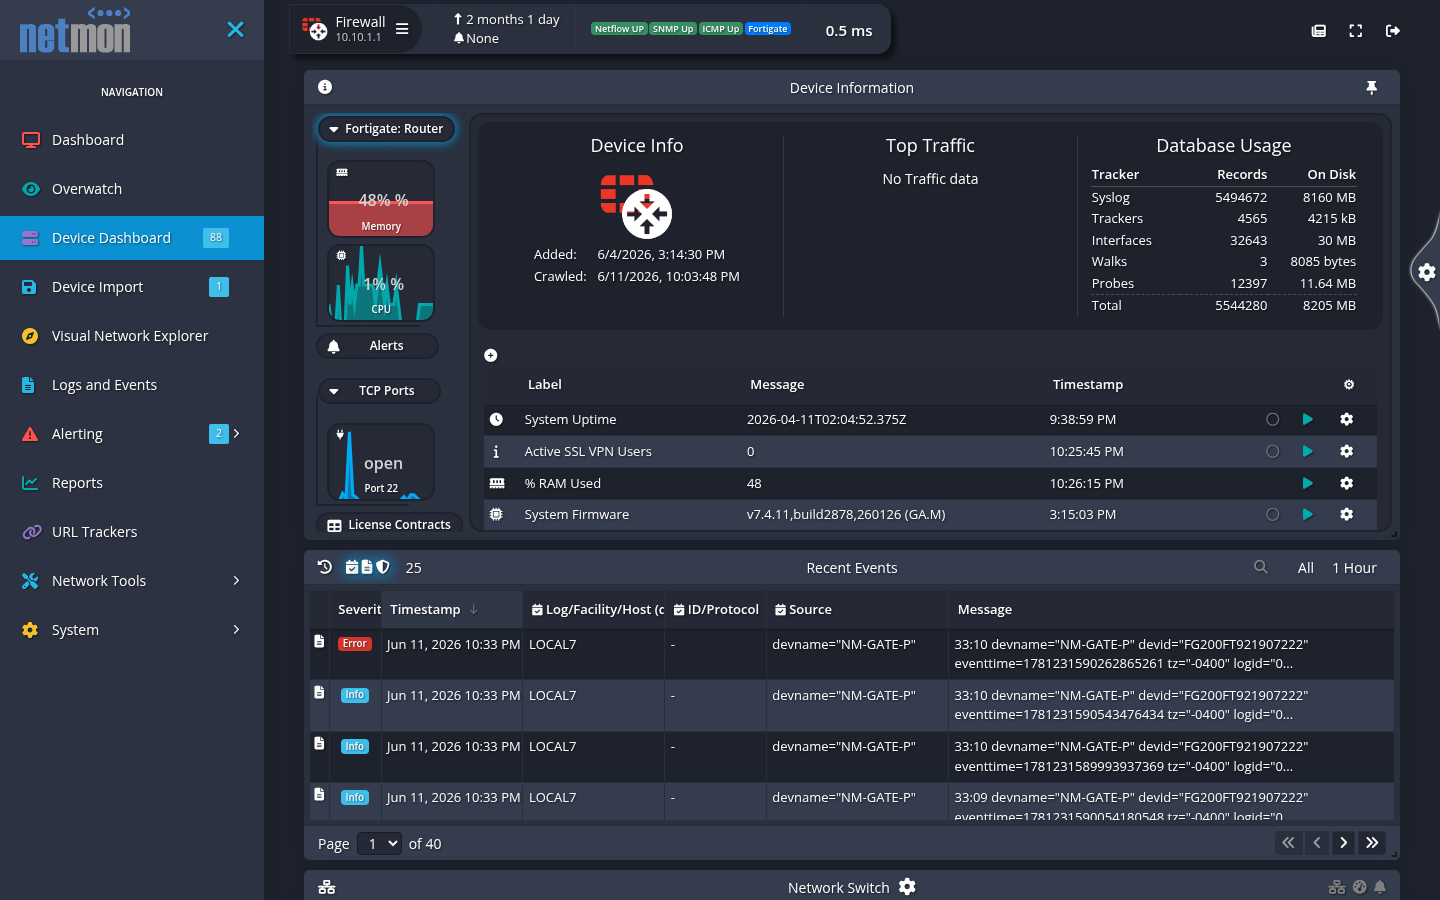
Netmon device dashboard — SNMP metrics, interface throughput graphs and tracker tiles for a network device
Traffic analysis & intrusion detection

Watch Your Traffic Move

The appliance watches the traffic on its monitored interfaces continuously, so when somebody asks on Thursday why the link was saturated on Monday night, you answer from evidence you already have — not from a capture you wish you had started.

  • Continuous packet inspection runs on a mirror or SPAN port, with no agents to deploy, no polling and nothing to change on the devices themselves. For the segments the appliance cannot see directly, flow export fills the gap — NetFlow v1, v5, v7 and v9, full IPFIX, and sFlow — and a 14-vendor switch configuration guide walks you through the exporter side.
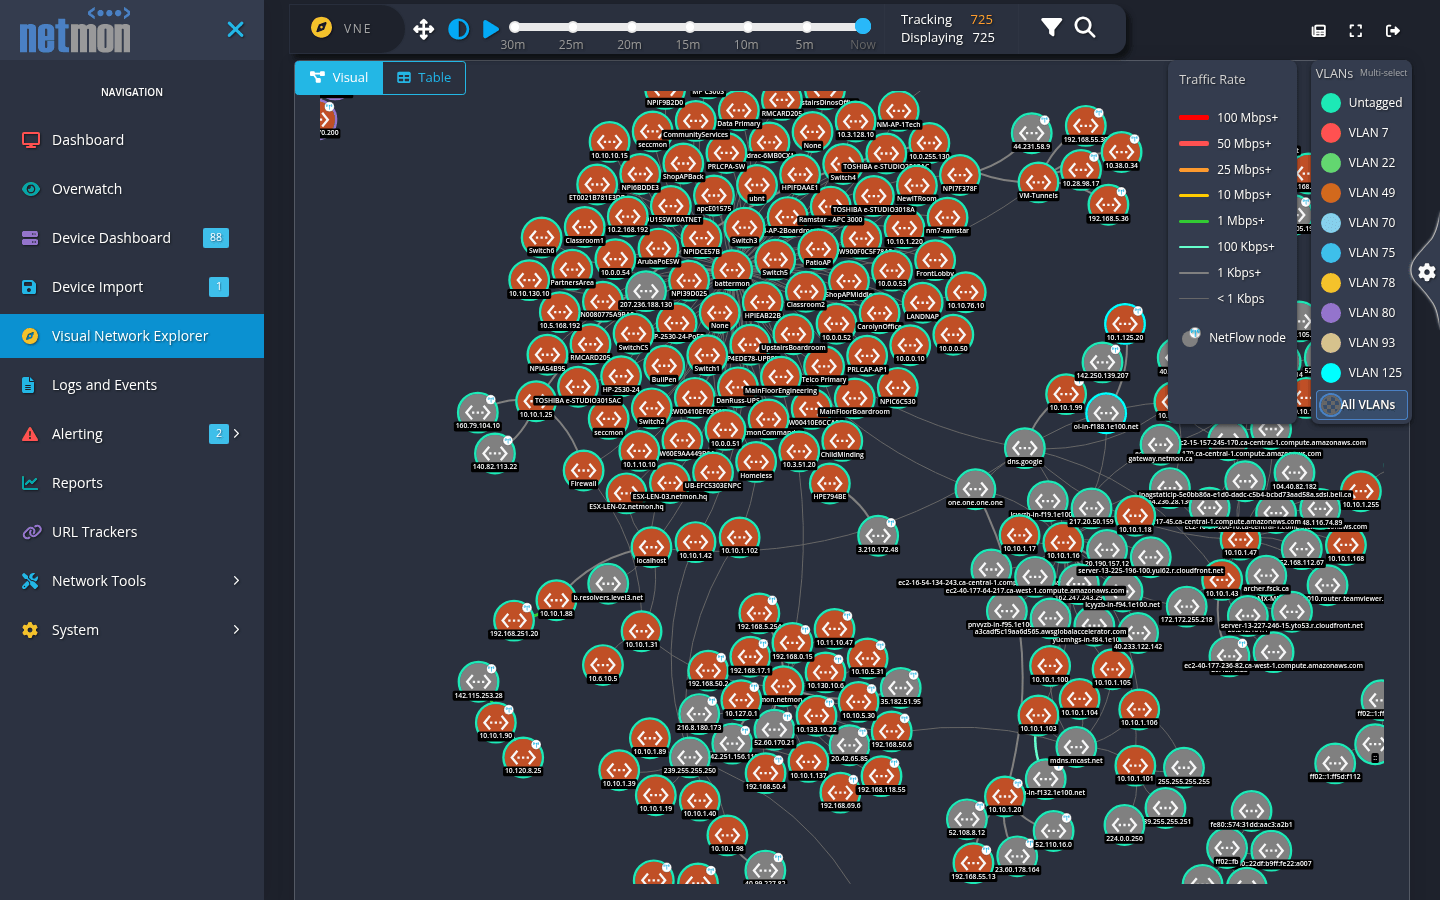
  • The Visual Network Explorer turns all of that into a map of who is talking to whom, refreshed every 30 seconds, with a slider that walks back through the last 30 minutes. Flip the Visual/Table toggle and the same window becomes a plain conversation ledger you can read row by row.
  • Intrusion detection watches that same mirrored traffic around the clock — the appliance runs the open-source Suricata engine with the Emerging Threats Open ruleset, refreshed daily, and Netmon reads every finding it produces onto the same log timeline as everything else you collect.
Netmon Visual Network Explorer — traffic map with VLAN and traffic-rate legends and a 30-minute playback slider
Packet Capture & Wireshark

When You Need Proof, You Get Packets

Because the appliance is already inspecting every packet on its mirror port, a capture is just a filtered slice of what it was already watching. It starts instantly — while the problem is still happening — with no SSH session, no tcpdump syntax, and no walk to the closet with a laptop.

  • Filter by host, port, protocol, VLAN or interface, with a byte cap and a time limit so the capture you forgot about stops itself. Everything lands as standard .pcapng, private to the person who started it, behind a permission you grant explicitly.
  • Or skip the download entirely: the Wireshark integration puts your Netmon in the workstation’s capture-interface list, and a running capture streams straight into Wireshark — packets appear about a quarter-second after the appliance sees them.
  • Ships for Windows, macOS and Linux, on x86-64 and ARM64, signing in with a browser approval and pinning the appliance certificate the first time it connects.
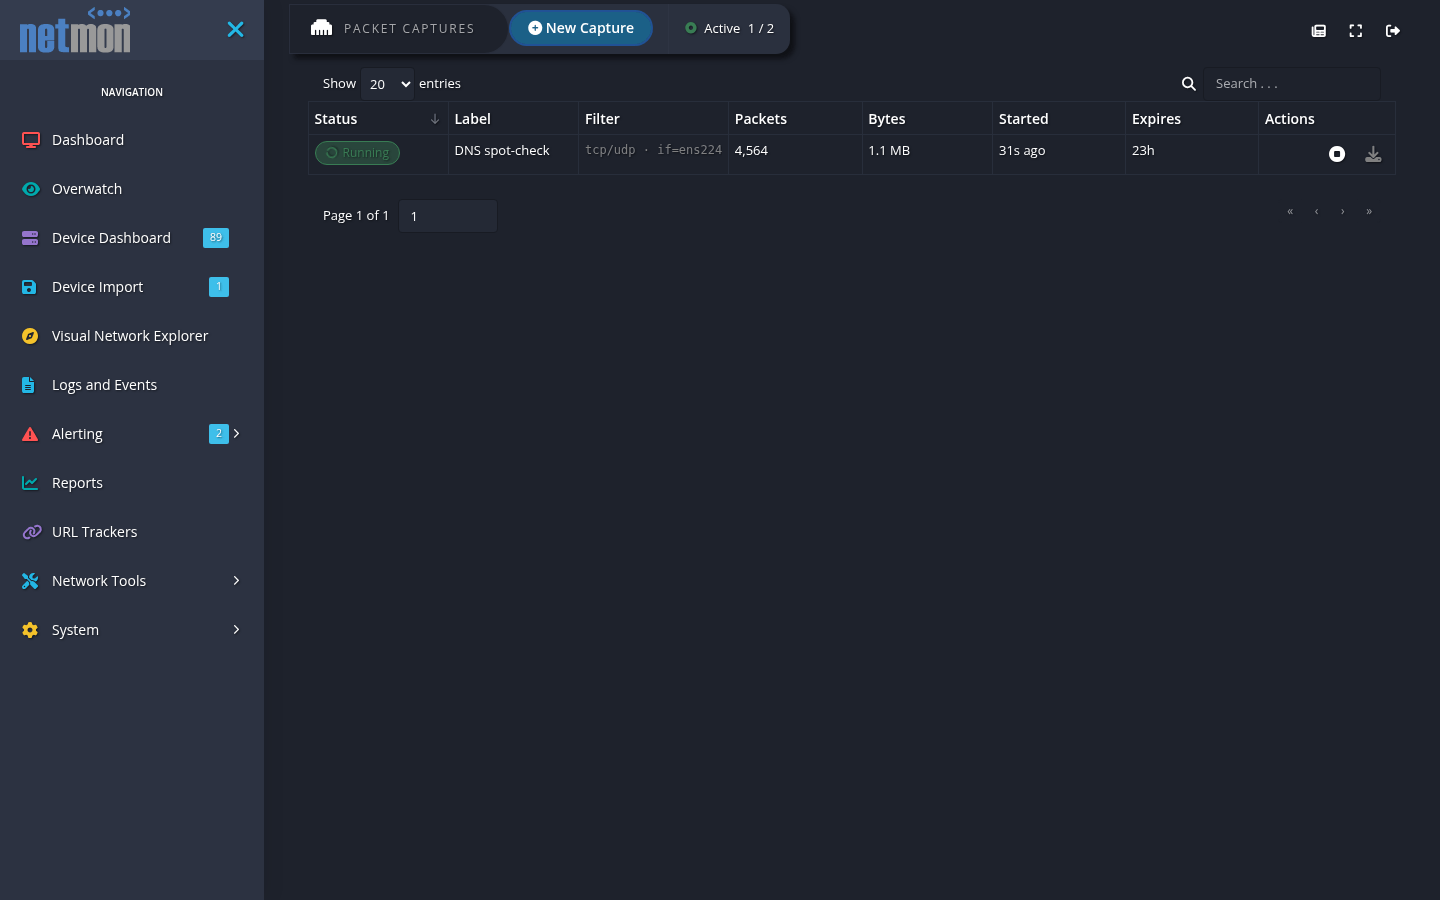
Netmon packet captures — filtered capture list with status, size and download to pcapng
Logs & events

Every Log on One Time Axis

Syslog from your network gear, Windows event logs from your agent hosts and intrusion-detection events all land on one page behind one search box — and any search you find yourself running twice a week can become an alert instead.

  • The appliance is a standard syslog server — UDP and TCP on port 514, speaking RFC 3164, RFC 5424 and CEF — so on most equipment, pointing your logs at it is a single line of configuration.
  • Alerts are built the way you would describe them out loud: five or more matches at Error or worse in the last ten minutes, from devices tagged domain-controller.
  • Exclusion filters tidy up the view without touching the underlying record, so hiding a noisy entry today never quietly switches off the alert you built on it last month.
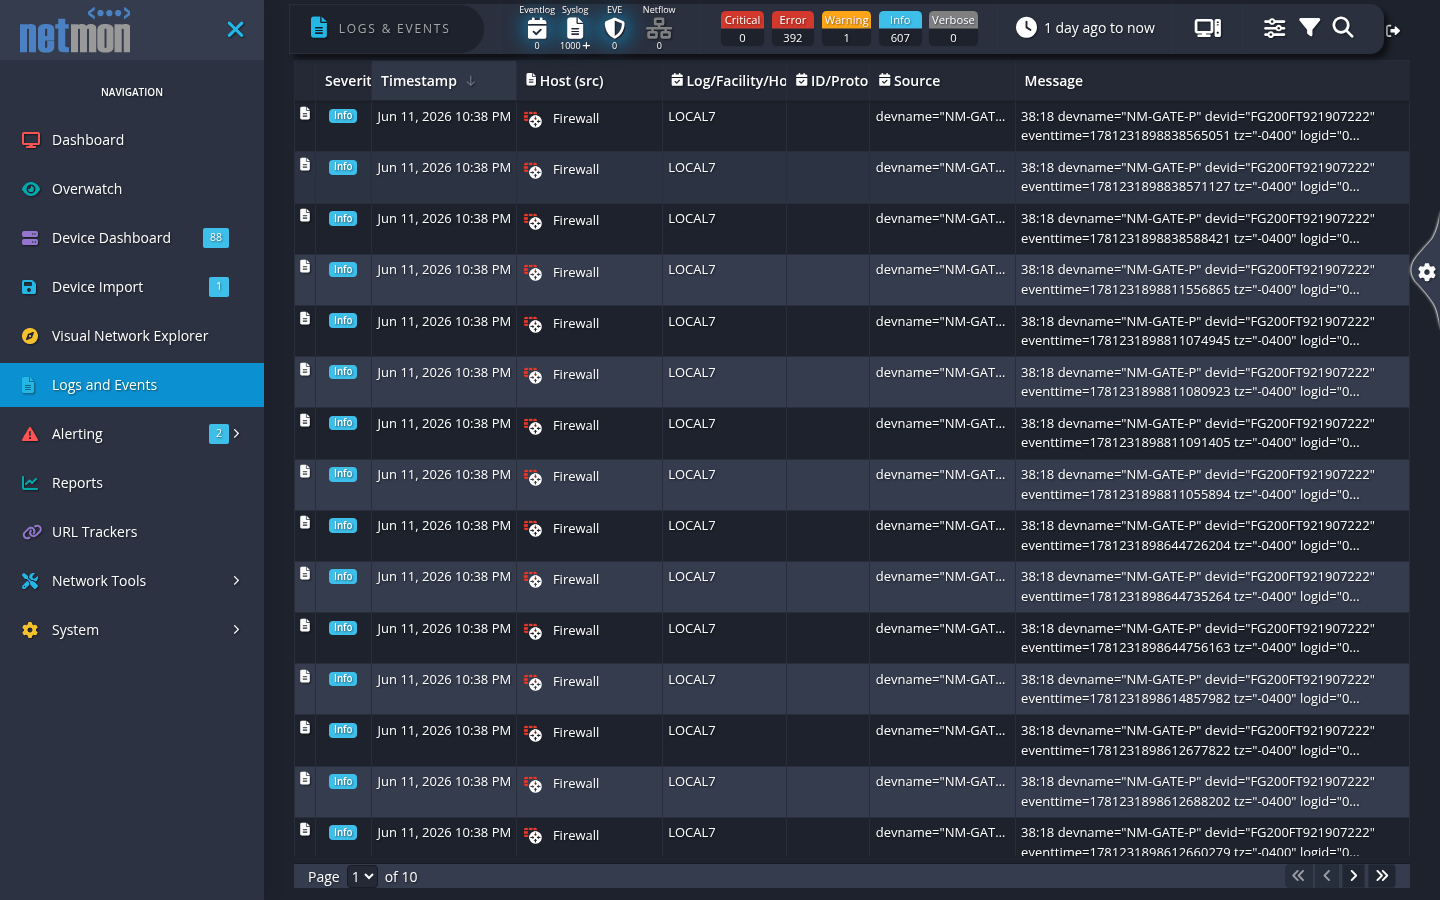
Netmon Logs and Events — syslog, Windows event log and IDS entries interleaved on one searchable timeline
Alerting

The Right People Find Out, Automatically

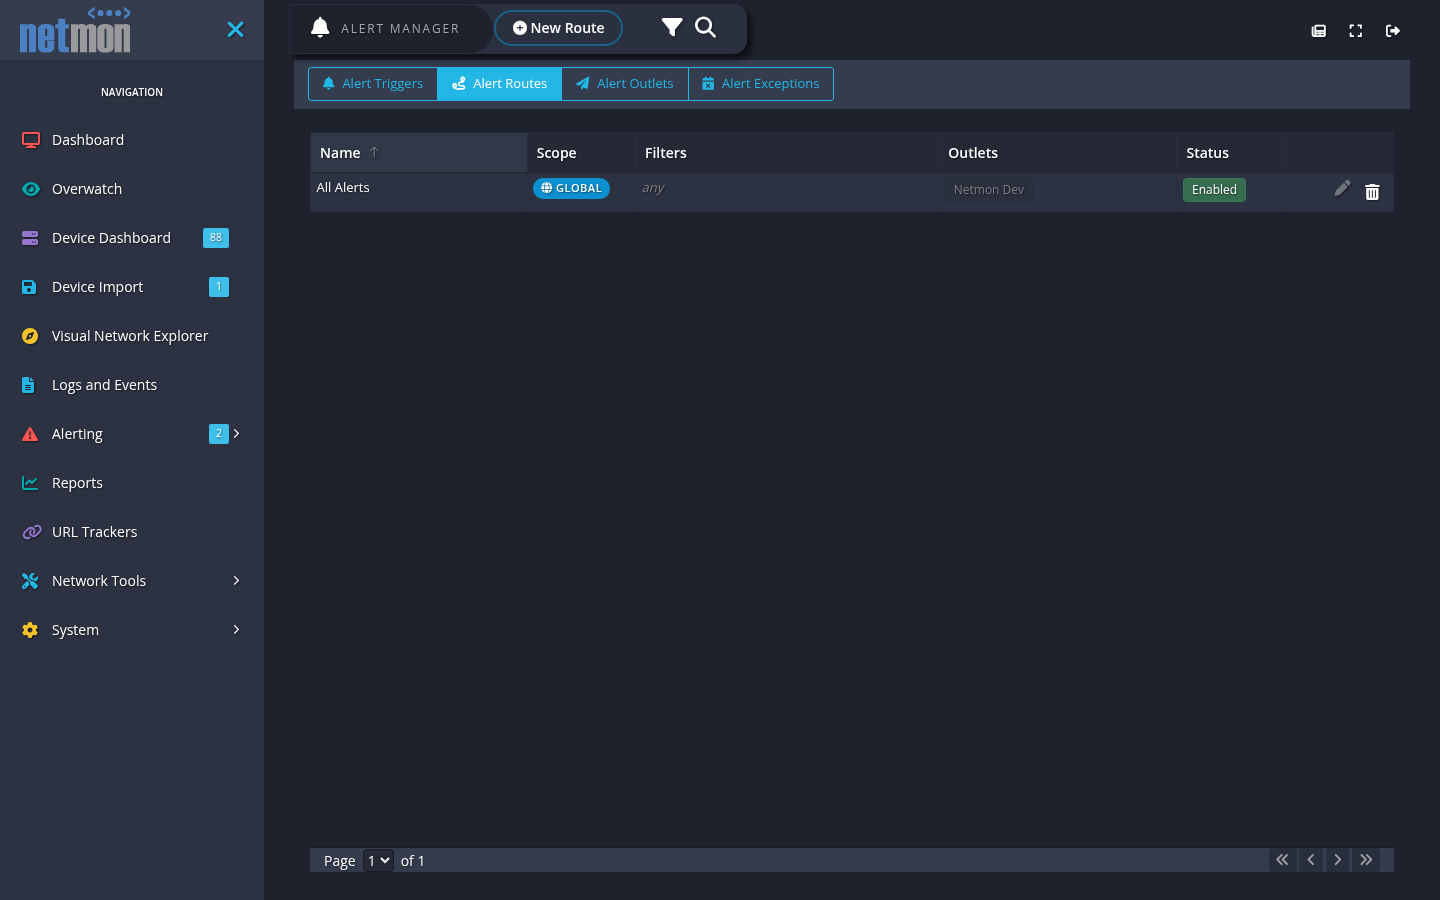
Alerts do not own their recipients — routes do. Describe once who should hear about what — by tag, by severity, by kind of event — and every alert that matches finds its way out: to email, Microsoft Teams, Slack, Discord, or any webhook you point it at.

  • Routes add up instead of competing, so a specific rule can never silently swallow the general one — the catch-all that emails you always still fires. When the on-call person changes, that is one routing edit, not an evening spent auditing every alert in the system.
  • Maintenance windows attach to the routes you choose, so Sunday patching does not page anybody — while the equipment you are not touching keeps alerting straight through.
  • Every alert that fires is recorded whether or not anything was delivered, so “did we get told?” always has an answer.
Netmon alert routing rules — scope, class and tag filters fanning out to email and webhook outlets
API, PowerShell & AI assistants

Ask Your Network a Question

Because the whole network lives in one system, you can now simply ask it things. Everything the web interface shows is reachable over a documented REST API — and the newest client is an AI assistant.

  • 306 documented API paths, published by the appliance itself as an OpenAPI 3.1 specification — so the reference always matches the software your box is actually running, and your tooling can generate a client straight from it.
  • A built-in MCP server exposes 36 tools to AI assistants — devices, logs, flows, alerts, captures, SNMP walks — over OAuth 2.1, with the scopes you choose at consent time. Every tool is read-only: the server exposes no write operations at all, so nothing can change device state, stop a service or touch a configuration. The assistant signs in as you, sees only what you could see, and you can revoke it whenever you like.
  • 28 PowerShell cmdlets (PowerShell 7+) wrap that same API — Connect-Netmon, Get-NetmonDevice, Search-NetmonSyslog, Test-NetmonMTR — and compose like anything else in a pipeline.

You: Which devices went down overnight — was it one switch?

Claude: Three devices lost ICMP between 02:11 and 02:13, all behind Switch6 (10.0.1.161) — which logged a link-down on port 14 at 02:11:44. The rest of the fleet stayed up, and the incidents closed on recovery at 02:19.

Illustrative session — an AI assistant connected to the appliance’s built-in MCP server, read-only.

Local & air-gapped

Your Monitoring Stays on Your Network

Netmon is hardware you own, running inside your own perimeter. Collection, storage, alerting and the web interface all live on the appliance, so there is no cloud tenant to sign up for, nobody else holding your data, and your monitoring data never leaves the rack.

  • Routine outbound traffic is a short and honest list: the signed software-update feed, IDS signature updates, license-activation checks, and an optional geo-lookup you can switch off. Nothing else phones home.
  • For networks with no outbound access at all, air-gapped builds are available — those forgo online updates and the online-delivered IDS ruleset.
  • And the appliance checks its own work. System Health asks the question a green “running” badge cannot answer — has data actually arrived lately, are the alert queues draining, how old is the newest backup — so a quiet monitoring failure announces itself to you, not to the morning after.
  • There is no per-device licensing and no per-sensor meter to watch: the tiers are sized by hardware, and a licensed appliance keeps itself current with signed software updates.
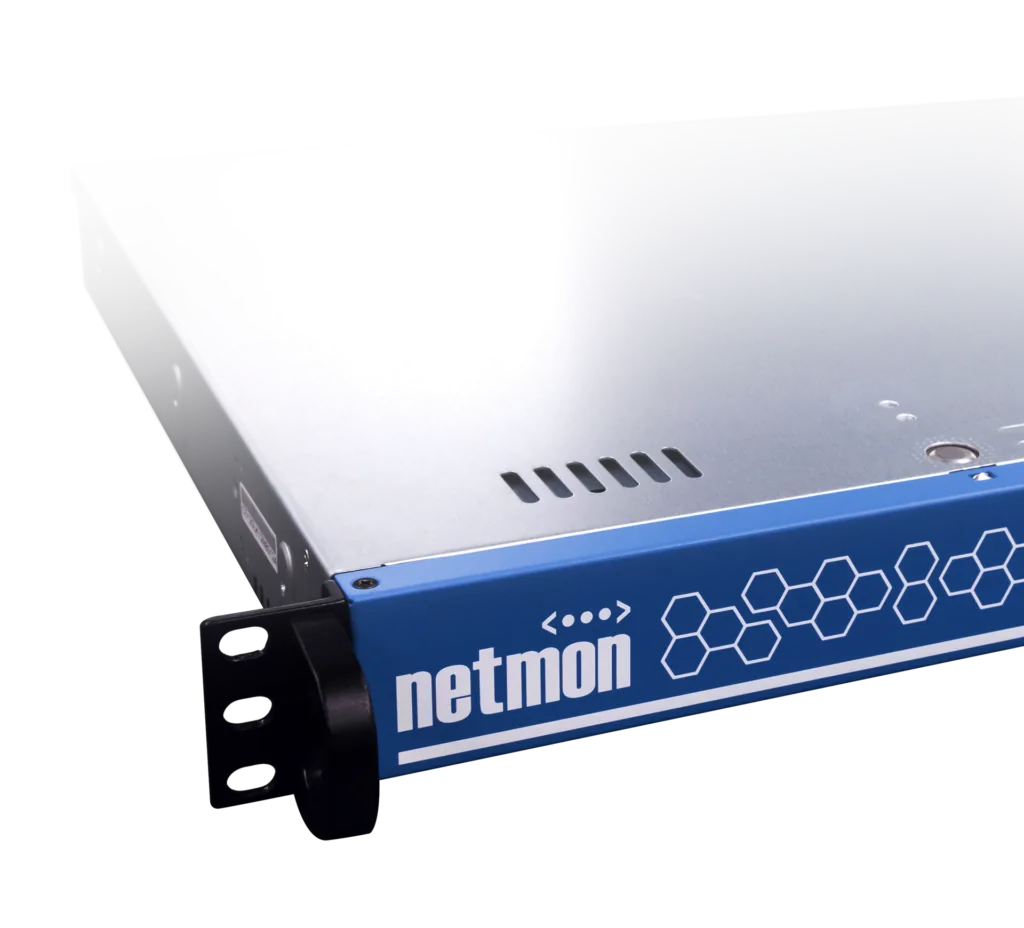
Netmon Enterprise appliance, a 1U rack-mount unit with a blue front bezel, shown front-on

Diagnose It From the Appliance

When something is wrong, the tools you would reach for are already here — ping, traceroute, MTR, an SNMP walk, a port scan, a speed test — and they run from the same vantage point that raised the alert you are chasing, which is usually the vantage point that matters. Every tool page carries the device picker, so running one against a particular device is two clicks rather than a hunt for its IP address, and throughput testing includes an internet speed test alongside iPerf client and server modes. When a diagnosis needs the packets themselves, the packet capture described above is the deep end of the same toolbox.

Ping Traceroute MTR SNMP Walk Port Scan Speed Test + iPerf

Up and Running in Four Steps

  1. Order

    Choose SMB or Enterprise. One price covers the box, and there is no per-device meter waiting for you later.

  2. It Ships to You

    It arrives preconfigured and ready to power on.

  3. Rack It, Give It an IP

    That really is the whole prerequisite list.

  4. Guided Deployment

    Eight hours of guided setup, included with an appliance purchase — discovery, device profiles, alert routing and your first dashboards, all worked through together with you.

Common Questions

Does Netmon need internet access or a cloud account?

No. Collection, storage, alerting and the web interface all run on the appliance, inside your network — your monitoring data never leaves it. Routine outbound traffic is limited to the signed software-update feed, IDS signature updates, license-activation checks, and an optional geo-lookup you can switch off. Air-gapped builds are available for networks with no outbound access at all; those forgo online updates, and because the intrusion-detection ruleset is delivered online, IDS is not included in the air-gapped build.

How many devices can one appliance monitor?

Netmon SMB covers up to 100 devices and Netmon Enterprise up to 1,000. There are no per-device license fees within a tier — the ceiling is hardware sizing, not billing.

What if we outgrow the SMB appliance?

Talk to us before you reach the ceiling and we’ll plan the move to an Enterprise appliance around your log-retention needs.

How long does deployment take?

Rack it and give it an IP, then we run a guided deployment session with you — eight hours, included with an appliance purchase — covering discovery, device profiles, alert routing and your first dashboards. Most networks are monitored on day one.

See It Running on Your Own Network

A guided demo runs on a real appliance with real data, and we will point it at the questions you actually need answered. If you would rather look around by yourself first, the live demo is open right now — click into anything you like.

or give us a call at 1-800-944-4511