Device Dashboards v7.0.20
The device dashboard is the single page for one device — its live status, its tracked readings and graphs, the port-level switch view, and the Settings pane where you tune exactly what Netmon collects.
Every device has a dashboard: the single page that answers “how is this box doing, and what has it been telling us?” Open Device Dashboard in the sidebar, then pick a device.
Finding a device
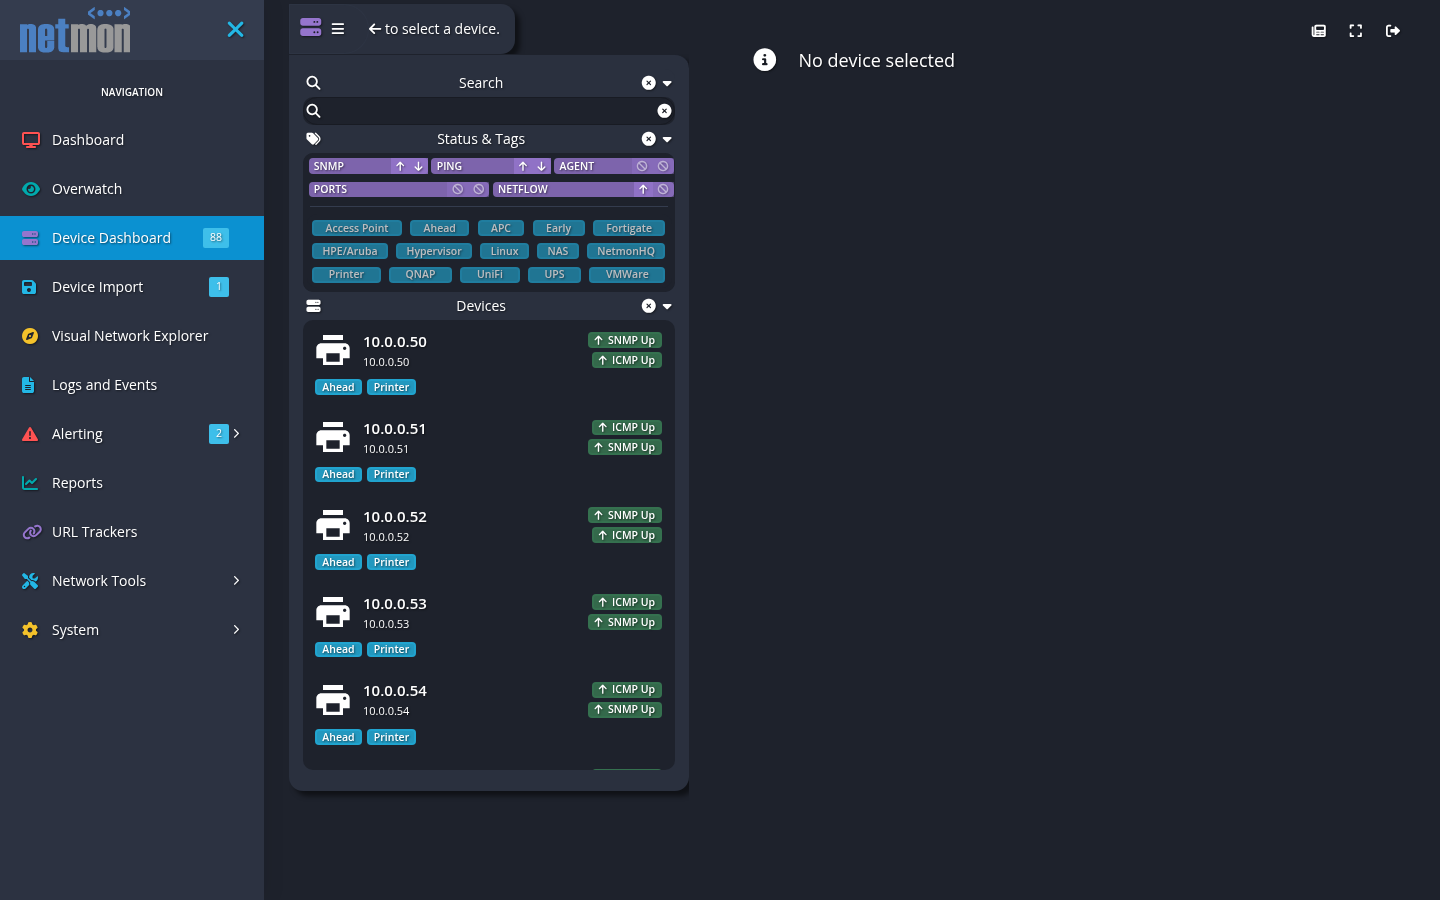
The device picker drops down from the page header. It searches as you type, and filters two ways: by status chips (show only devices with SNMP down, ping down, and so on) and by tags. Each device tile shows its icon, label, address, live status chips, and tags — the picker is a working fleet view in its own right, and it follows you onto the diagnostic tool pages, which operate on the selected device.
Reading the dashboard
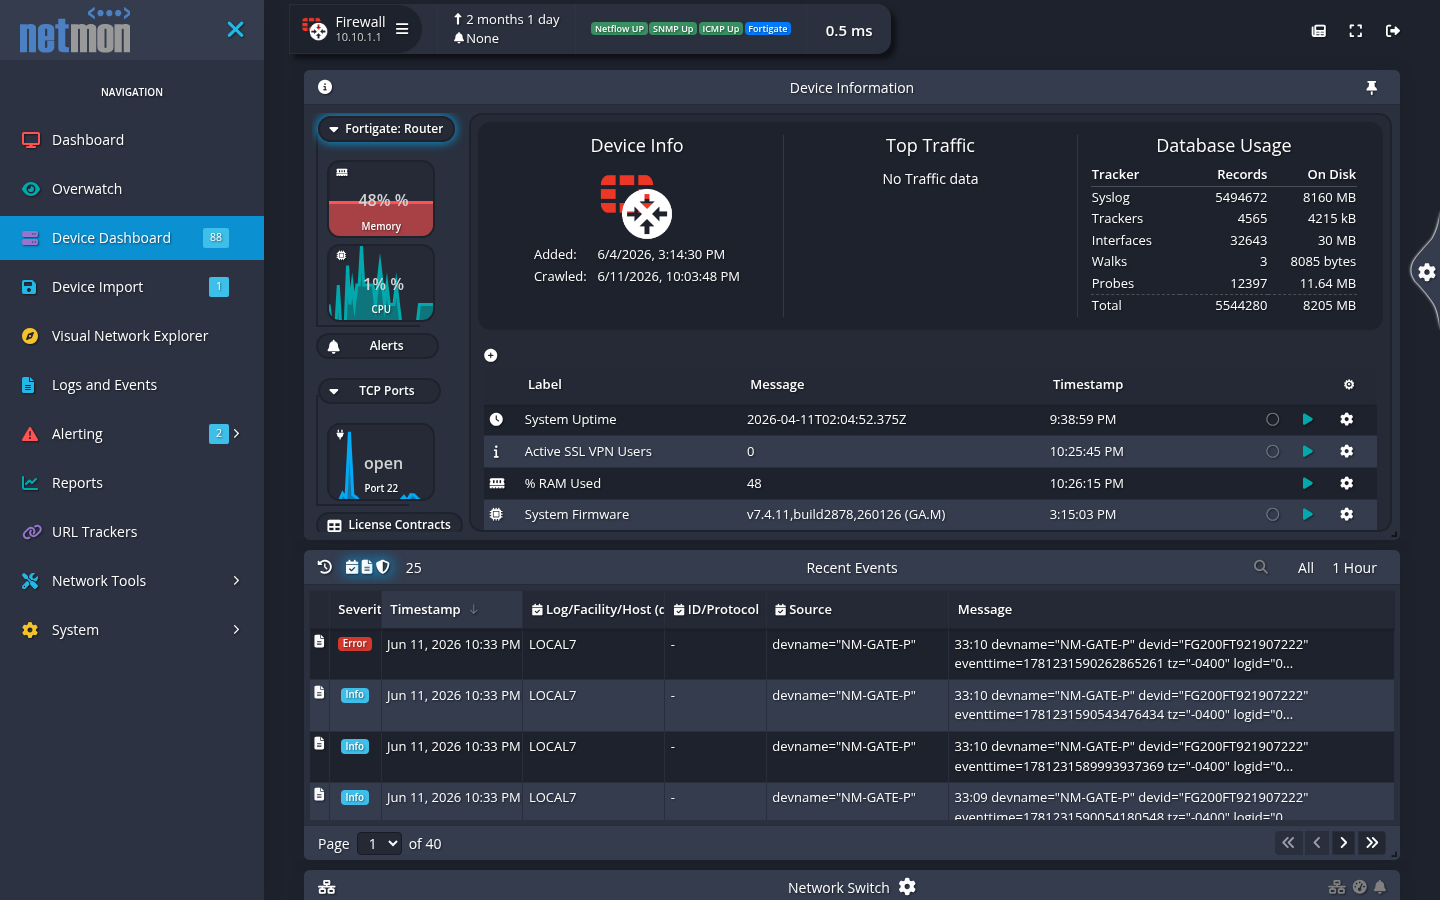
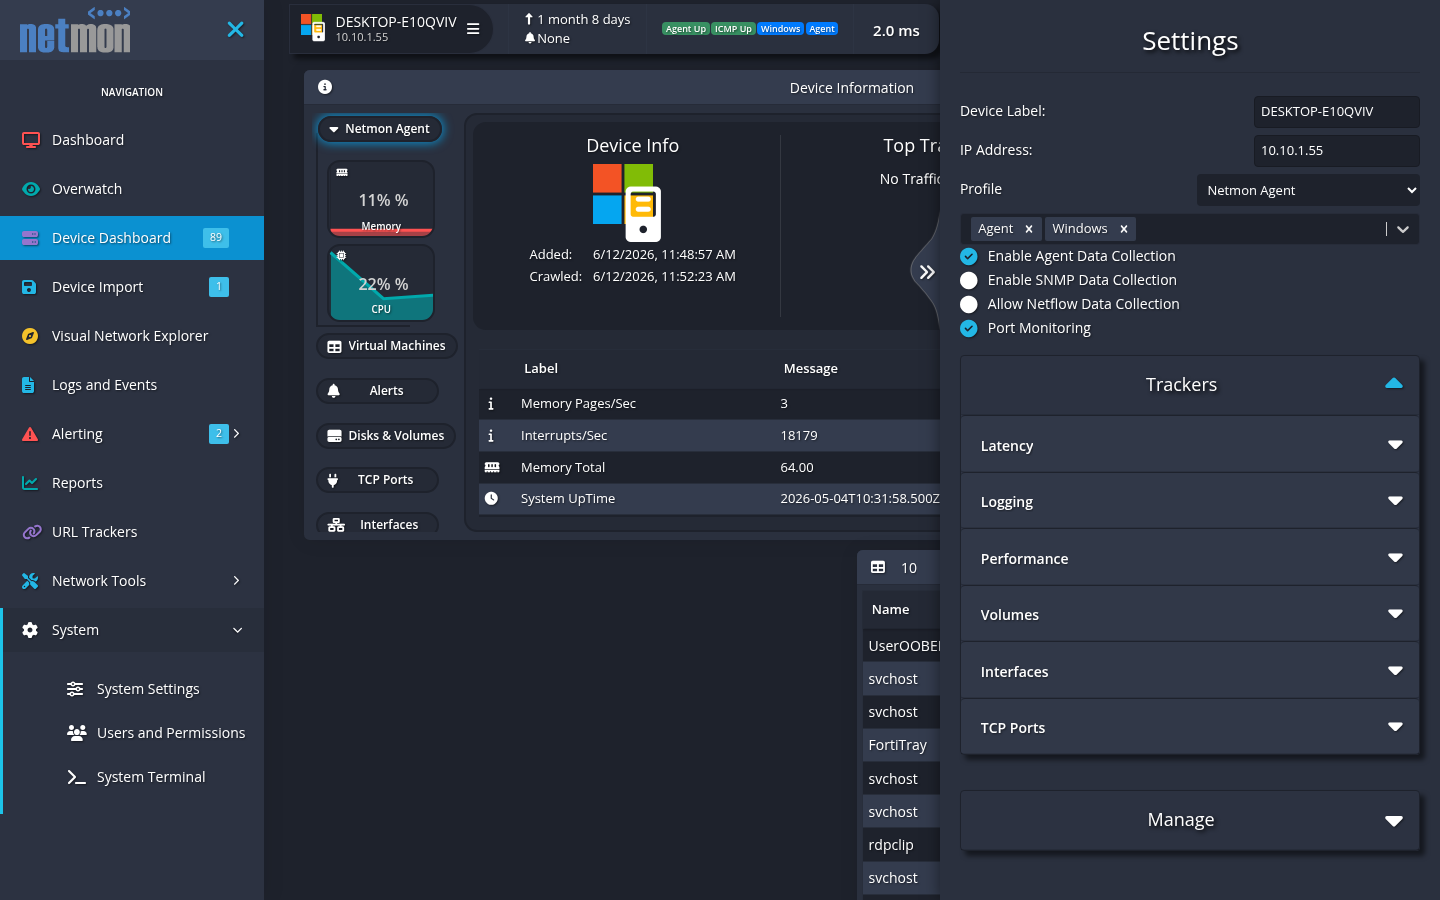
The header line carries the essentials: label, address, uptime, current latency, the profile chip, and a status chip per monitoring method. Below it, the dashboard is a grid of cards; exactly which cards appear follows from the device’s profile and what its monitoring methods deliver:
- Device Info — identity and bookkeeping: who added it, when, addressing.
- Messages — the device’s tracked readings as labeled rows (uptime, session counts, sensor values, license states…). Each row links to its graph and its alerting controls, and carries a configuration gear (see Configuring a tracker, below) — this is the fastest route from “odd number” to “graph of that number for the last week”.
- Top Traffic — what this device’s traffic looks like, when flow or packet data is available for it.
- Database Usage — how much history Netmon holds for this device, per data family (log, tracker, flow, probe data).
- Recent Events — the latest syslog/event-log lines attributed to this device, with severity chips and paging; the full investigation surface is Logs and Events.
- Interface and sensor graphs — throughput, error, CPU, memory, storage, temperature trackers, as the profile provides.
The switch view
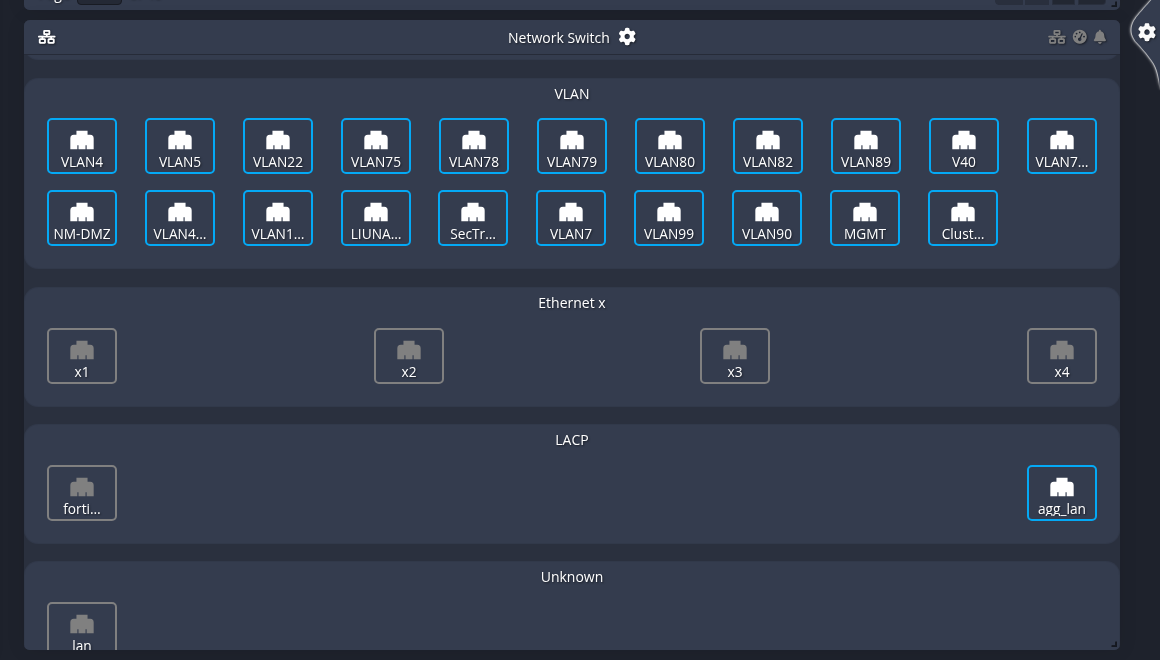
For switches, firewalls, and other port-dense equipment, the Network Switch card draws the device as its ports — physical interfaces, VLANs, and aggregates as labeled tiles you can inspect and toggle tracking on, port by port.
Adjusting what is tracked
The dashboard is also where a device is tuned. The gear tab on the right edge of the page slides out the device’s Settings pane: label, address, profile, tags, the polling switches (agent, SNMP, NetFlow, port monitoring), and a Trackers section grouping everything collected on this device — latency, logging, performance, volumes, interfaces, TCP ports — each group expandable, each tracker with its own configuration gear. From the cards themselves you can likewise disable an individual tracker (that rarely-interesting temperature probe; the VLAN nobody uses) or pin any graph to a Dashboard board. Changes apply from the next polling cycle; history already collected is kept.
Disabling a tracker stops future collection. The existing history remains readable and graphable until data retention ages it out, so turning something off is not destructive to the record.
Configuring a tracker
Each row the dashboard tracks — an interface, a disk, a sensor OID, the latency probe, a watched TCP port — carries its own configuration gear. The gear appears in two places, and both open the same dialog: at the end of each row on the readings cards, and beside each entry in the Settings pane’s Trackers groups. Use whichever is closer to hand.
Every tracker dialog is laid out the same way. A small column of icons on the left switches between a Config view (the gear) and an Alerts view (the bell); the reading’s history graph sits alongside, with an Hours picker (1 to 24 hours) in the header to set the window. The Config view always carries a label and a polling interval; trackers you can switch off individually also carry a logging toggle — turning it off stops future collection but keeps the history already on disk, as above. The Alerts view is where you set the thresholds that raise a notification; what those alerts then do — who is told, and how — is the subject of Alerting.
The rest of this section walks the trackers a polled network device exposes. Windows-agent devices add two more — event-log collection and Windows services, configured by the same gear; see The Windows Agent.
Custom OIDs
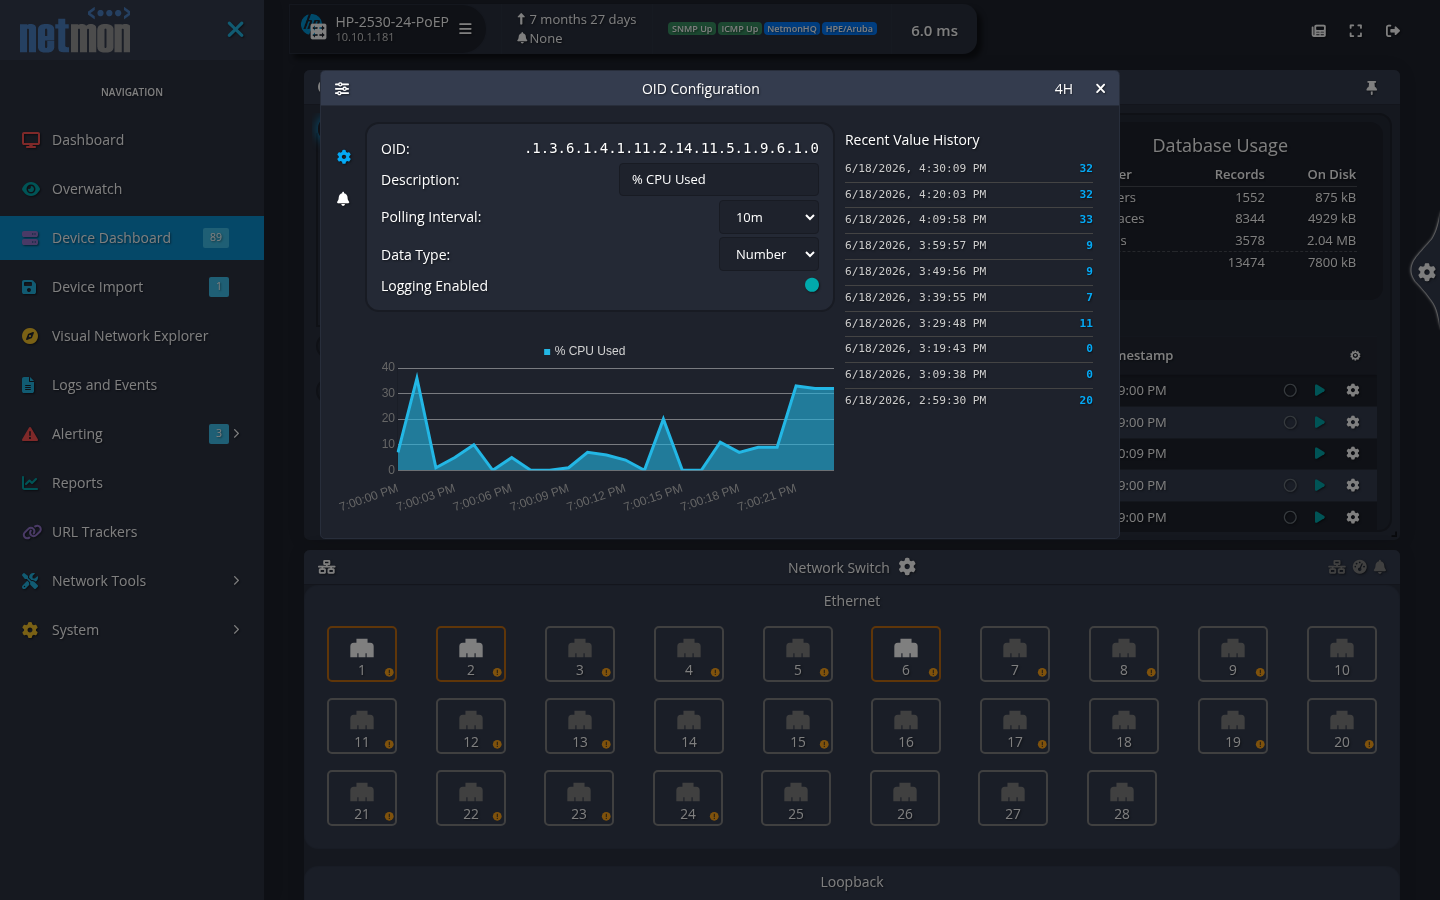
When a device is polled over SNMP, the readings card lists the values Netmon already understands — CPU, memory, sensors — and you can track any other OID the device exposes. The + above the readings table opens Add OID: enter the dotted-numeric object identifier (ending in .0 for a scalar value), give it a label, choose whether the value is a Number or a String, and set the polling interval (from one minute to once a day). Each tracked OID then gets a row with a gear that opens OID Configuration — the same fields, its history graph, and an Alerts view for thresholds on the value.
Interfaces
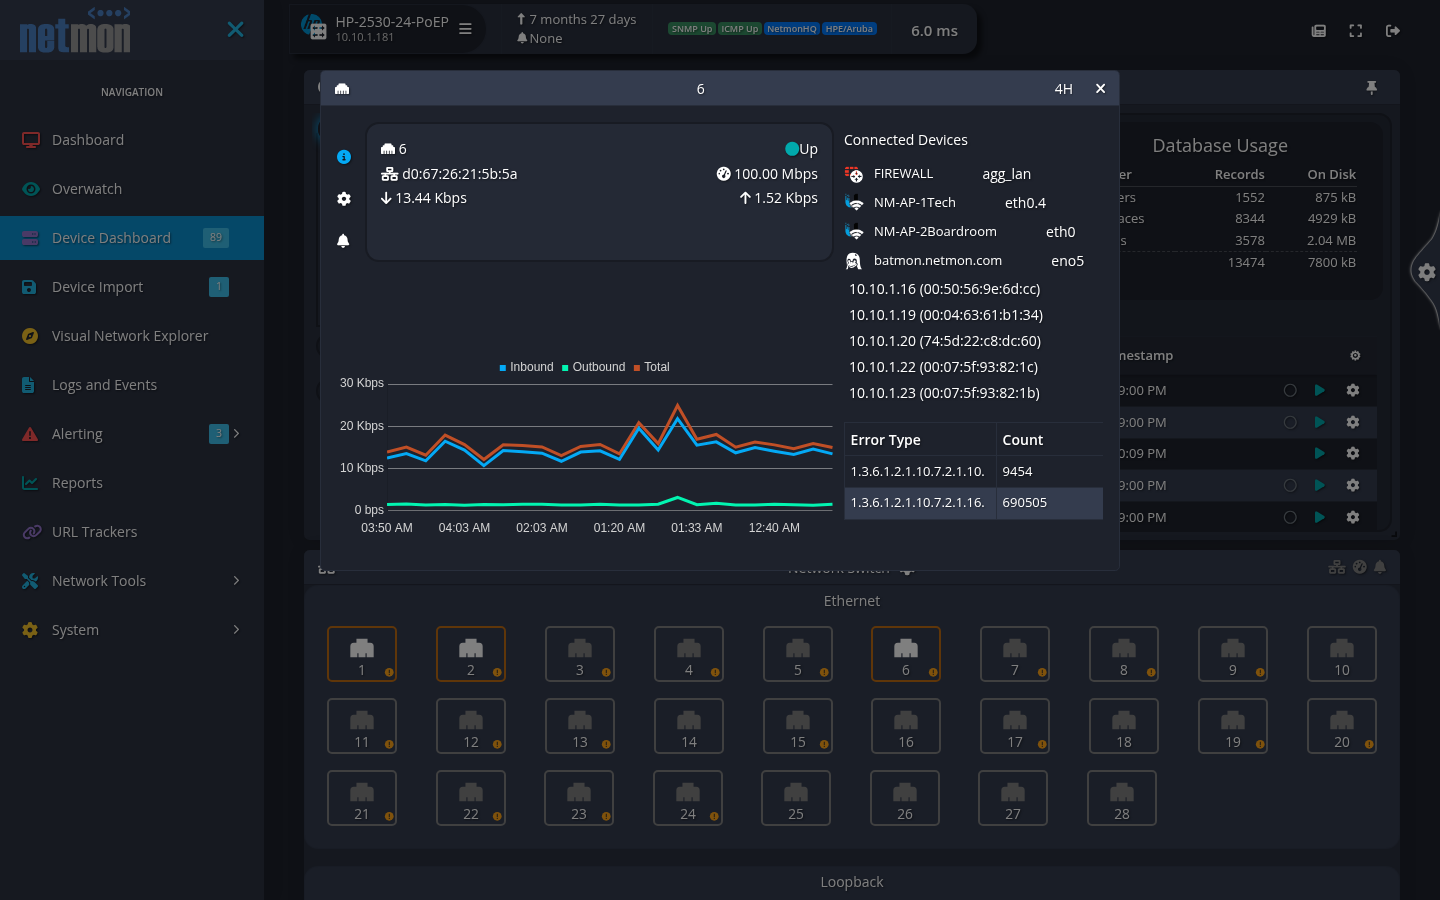
For an SNMP device with network ports, every interface is discovered automatically — there is nothing to add. Open one from the Network Switch card (click a port tile, or right-click it for quick actions: show details, start tracking, toggle an up/down alert) or from Settings → Trackers → Interfaces. The dialog opens on an Info view — link state, MAC, negotiated speed, live in/out rates, PoE draw where the port supplies it, and the devices seen on that port; the Config view sets a description and polling interval and turns tracking on or off. Interface alerts come in two kinds: bandwidth utilization (inbound, outbound, or either, above a percentage of link speed) and link status (up or down).
Disks and volumes
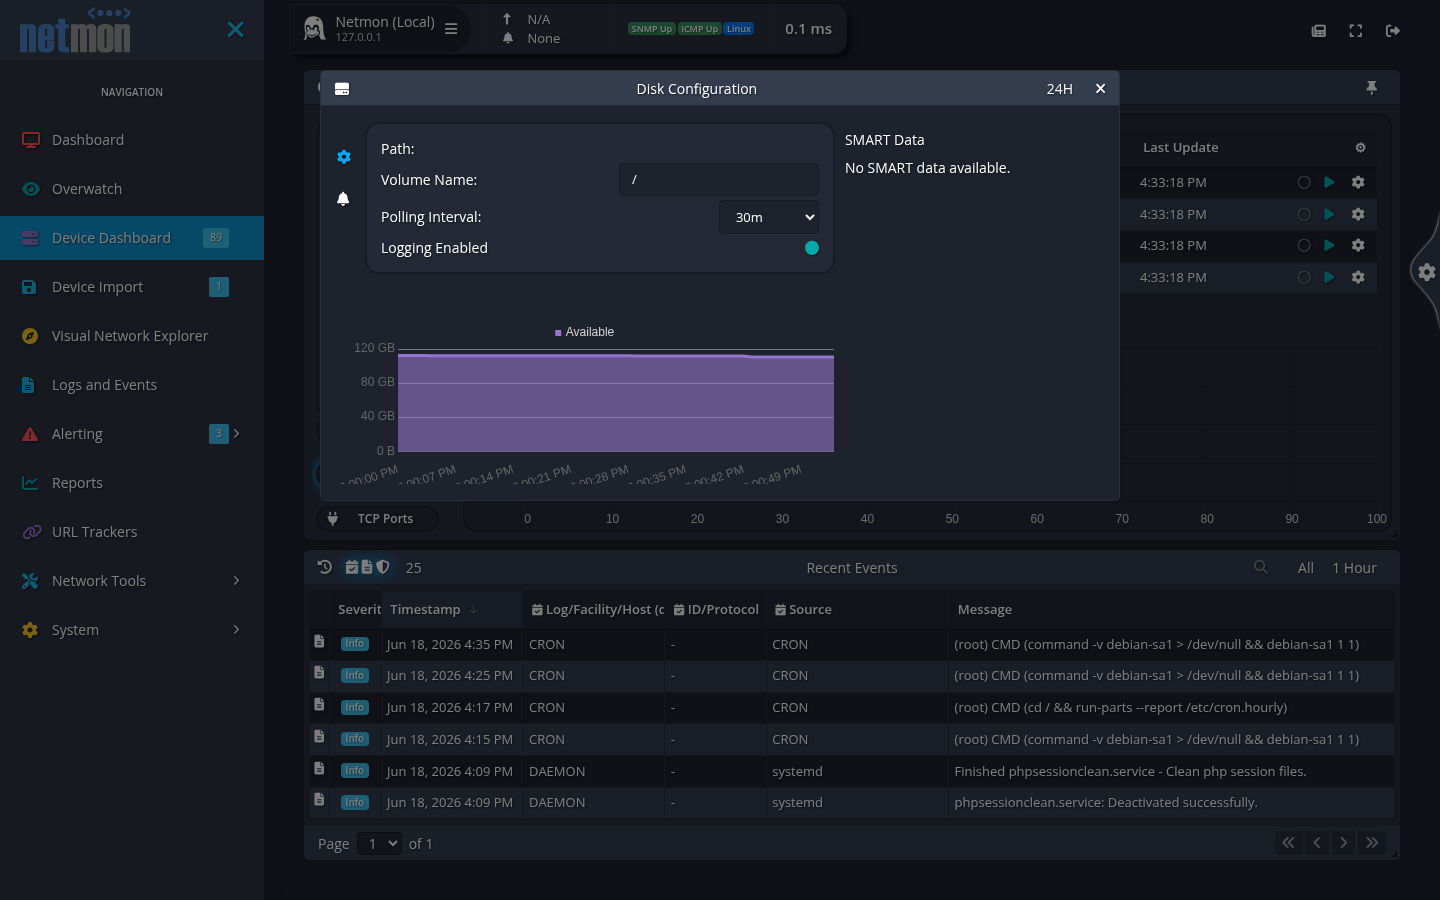
Storage is discovered on both SNMP hosts and agent devices, and appears under Settings → Trackers → Volumes and in the Disks & Volumes list of the Device Information card. Disk Configuration shows the volume’s path, lets you rename it and set its polling interval, toggles tracking, and graphs free space over time; the Alerts view raises a notification as a volume fills. On Windows-agent devices the dialog also surfaces SMART health attributes and a browsable breakdown of what is consuming space — see The Windows Agent for that view.
Latency
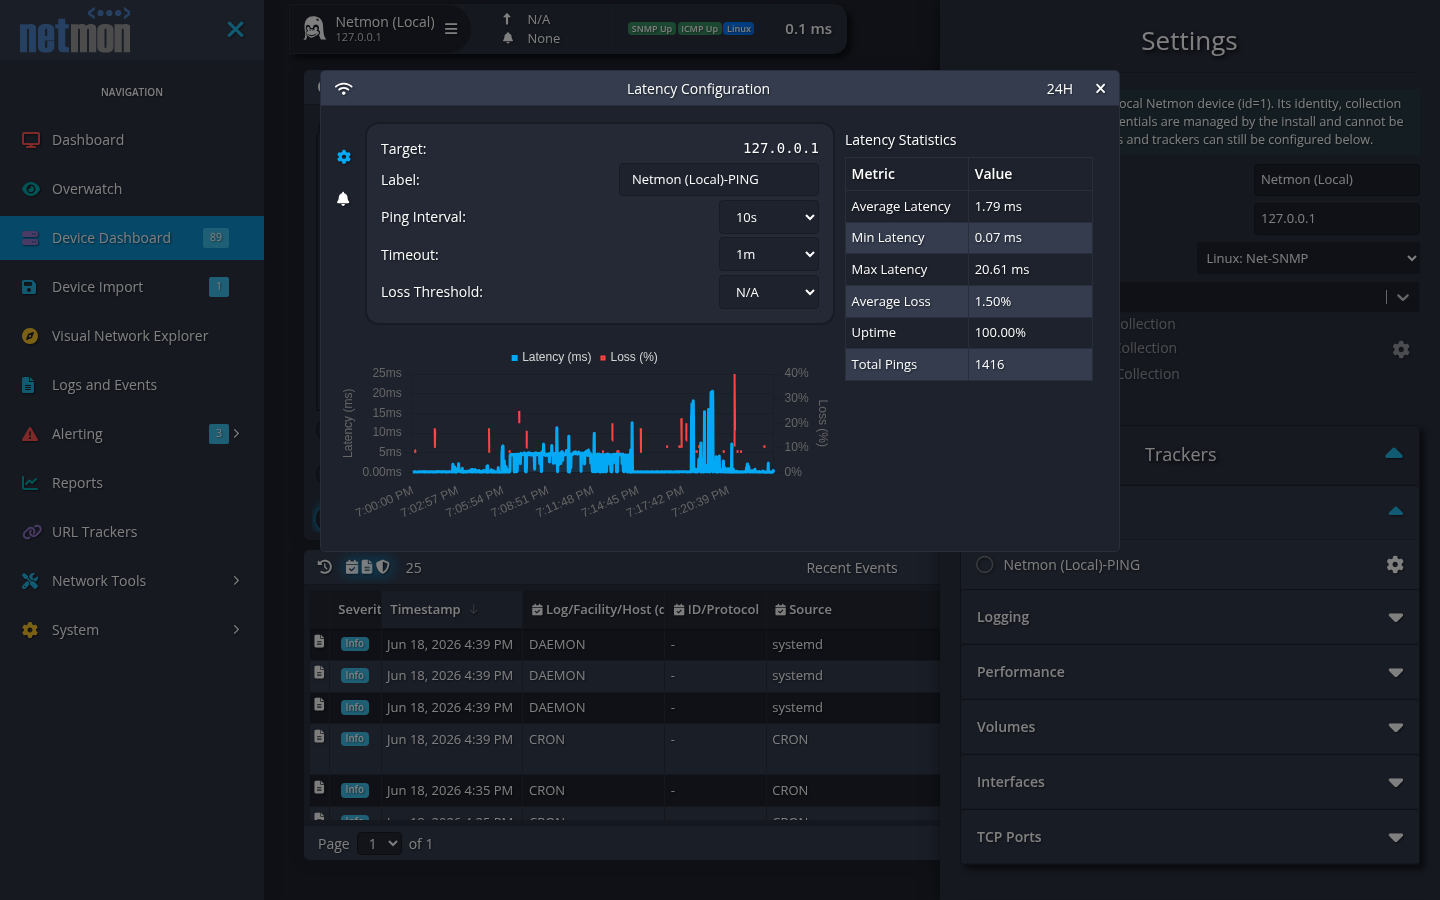
Every device Netmon pings has a latency tracker, reached from Settings → Trackers → Latency. Its Config view sets the ping interval, the timeout that counts a probe as lost, and a loss threshold at which the device is treated as down; alongside, it plots response time and packet loss and lists the running statistics (average, minimum, maximum latency, average loss, uptime). Alerts fire on sustained latency or loss.
TCP ports
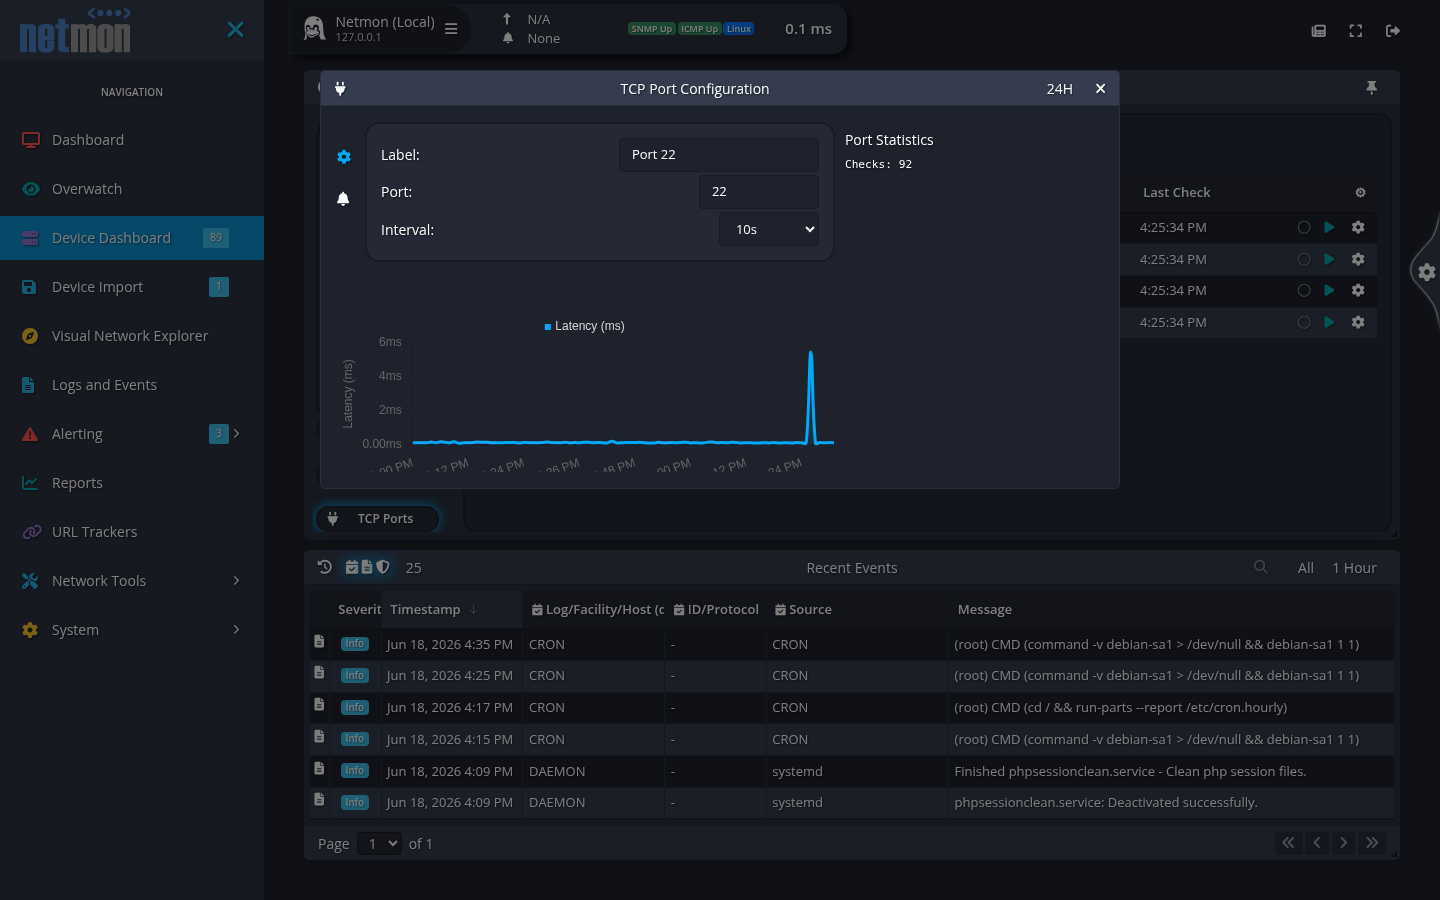
Where a device has port monitoring enabled, each watched port is a tracker under Settings → Trackers → TCP Ports (with a shortcut to the Port Scan tool — see Network Tools — for discovering more). TCP Port Configuration sets the label, the port number, and how often the port is checked, and graphs its connect time; an alert fires when the port stops answering.
Ports are not only added by hand. Where port monitoring is enabled, Netmon sweeps TCP ports 1–1024 on the device about once a day and adds a tracker for every port it finds listening, so a newly-published service turns up on its own. A port found that way is retired again once it has been absent from three consecutive sweeps — but only if Netmon discovered it rather than you, and never if it has an alert attached or has been pinned as a graph on the device’s dashboard. Ports you add yourself are never retired; they stay until you delete them.
A sweep only counts against a port when it actually proved something. If the host answered nothing at all — powered off, unreachable, or behind a firewall that silently drops everything — or the appliance was too busy to complete the sweep, that pass is discarded rather than counted as a miss. Retirement therefore needs three sweeps’ worth of real evidence, not three days on the clock.