
Visual Network Explorer v7.0.20
See the network whole: a live map built from observed traffic, backed by a sortable conversation ledger — for the questions no single device dashboard can answer.
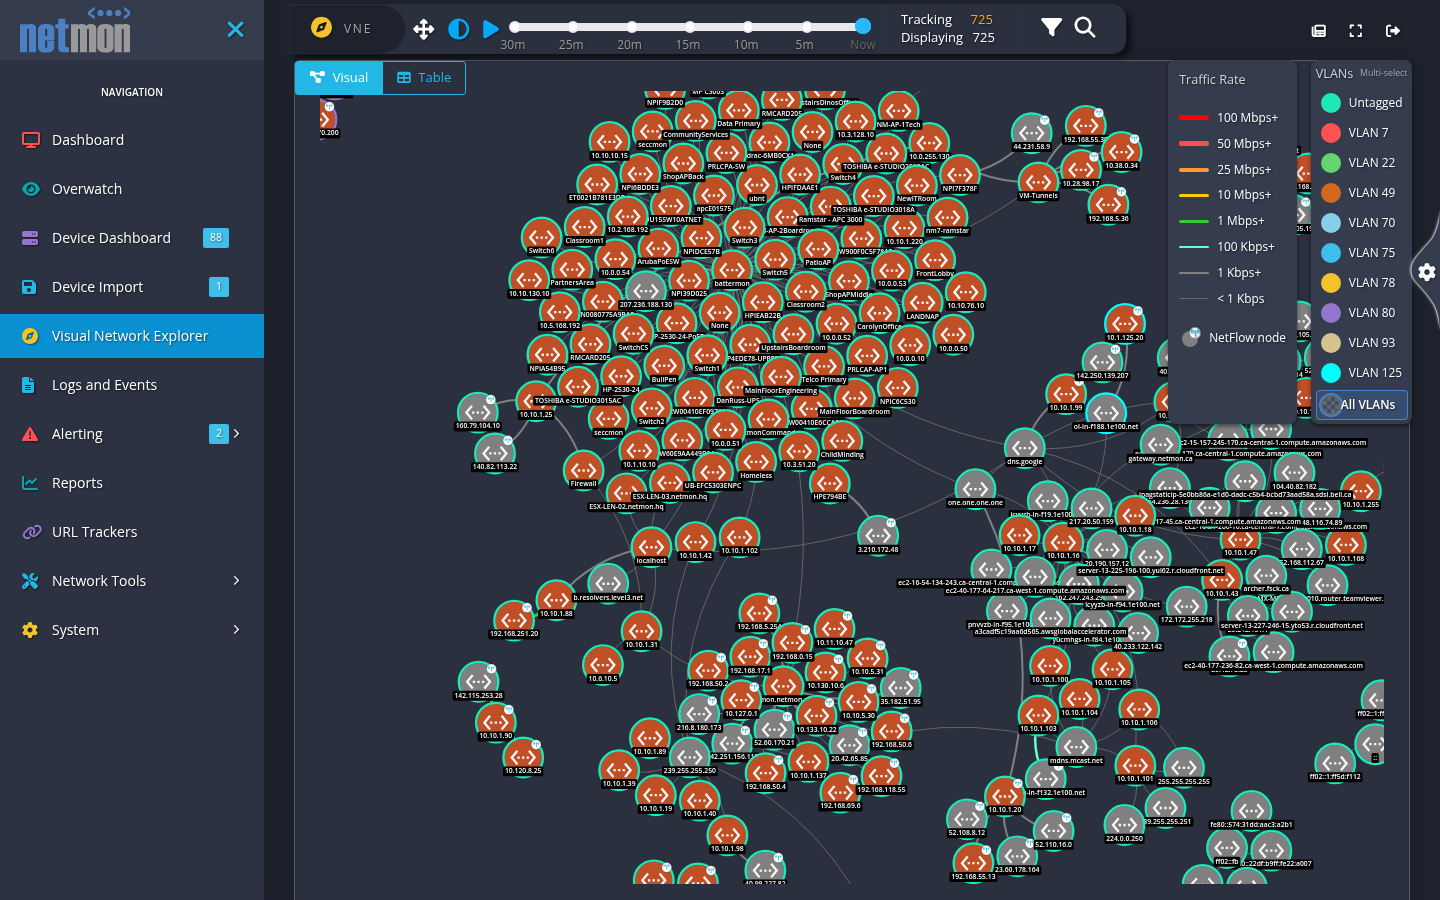
The Visual Network Explorer (VNE) draws your network as a live map: devices as nodes, observed relationships as edges, with traffic volume expressed in the connections between them. Where a device dashboard answers questions about one box, VNE answers the questions between boxes — what talks to what, through what, and how much.
Reading the map
Nodes carry the device icon and status coloring you know from the rest of the product; unknown-but-observed hosts appear alongside managed devices, so the map reflects the network you have, not just the one you imported. Edge thickness and the traffic-size legend translate observed volume into visual weight — a saturated uplink is literally the heaviest line on the page.
The toolbar provides search, filtering, and a time control: rewind the map to see what the network looked like during last night’s backup window, or narrow it to one device’s neighborhood when a hundred nodes are ninety-nine too many.
Two views of the same data
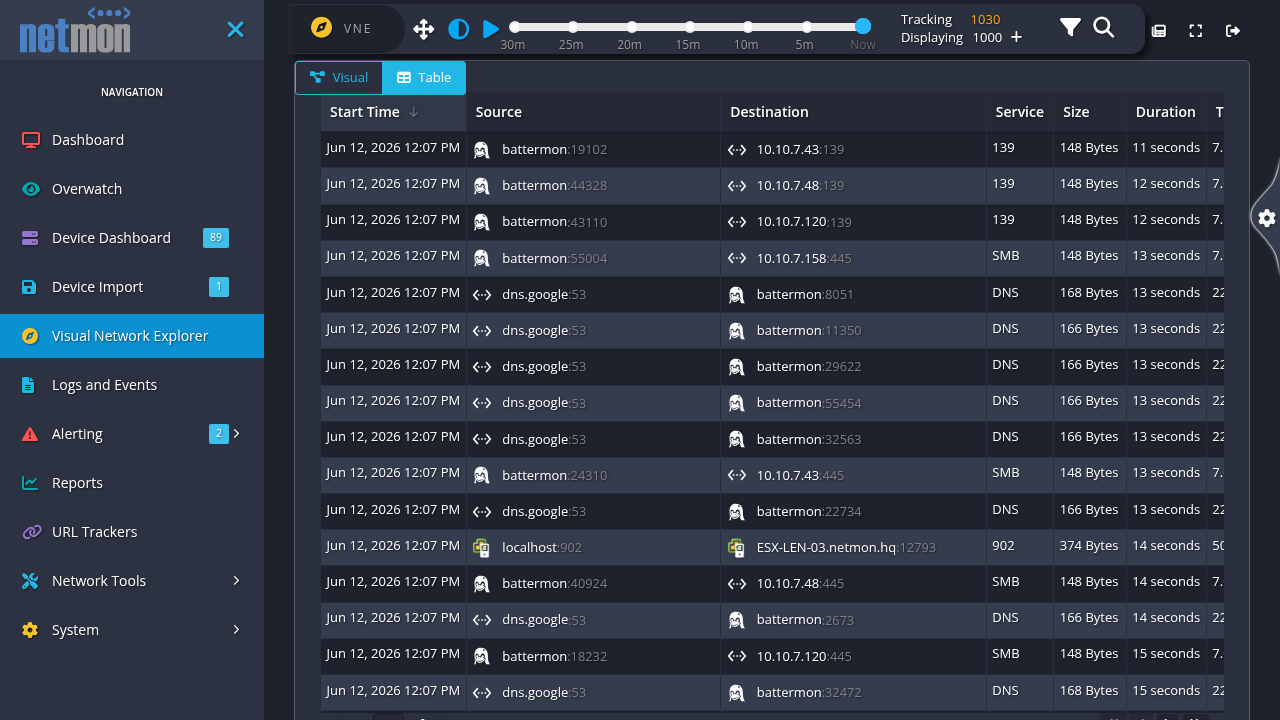
The Visual / Table toggle at the top switches between the map and a conversation ledger: every observed conversation as a row — start time, source, destination, service, size, duration — sortable and pageable. The map is for seeing shape; the table is for pinning down the specific conversation the shape made you suspicious of. Both views cover the same time window, so toggling between them keeps your investigation’s context.
Working from the map
The map is an investigation surface, not a poster:
- Click a node to open its details pane — the device’s identity, addresses, live status, and recent conversations — and jump from there to its device dashboard or the diagnostic tools, so an investigation that starts as a shape on the map ends on the page with the answer.
- Follow an edge to see the conversation it represents — protocols and volumes between that pair.
- Capture from context. When something on the map warrants packet-level inspection, a capture can be raised against the relevant device directly from this view (captures themselves are covered in Packet Capture).
What feeds it
VNE composes everything the appliance observes: the device inventory, ARP and discovery activity, and the traffic record — the appliance’s own continuous packet inspection first, extended by any NetFlow/sFlow your routers and firewalls export. The map’s completeness therefore follows from placement and configuration: an appliance fed by a SPAN port draws its local segments in full detail by itself, and flow export fills in the segments it cannot see directly. If a region of your network shows as sparse, Installation & First Sign-In (placement) and your flow-export configuration are the levers.