
Core Concepts v7.0.20
The vocabulary the rest of the guide assumes — what a device is, how it is watched, and how tags, permissions, and the monitoring services fit together.
Five ideas carry the whole product: devices, the monitoring methods that watch them, tags, users and permissions, and the monitoring services that do the work. Learn these once and every later chapter reads faster.
Devices
A device is anything with an address that Netmon watches: a router, a switch, a server, a printer, a UPS, a hypervisor, an access point. The device is the unit everything else attaches to — graphs, logs, alerts, reports, and topology all hang off a device record.
Devices enter the inventory three ways, all through Device Import:
- Discovery. Netmon watches your monitored network ranges and queues anything new it sees as a pending device for your review.
- Manual entry. The Add Device wizard creates a device from a label, an address, and a profile.
- Agent enrollment. Windows hosts running the Netmon Agent announce themselves and appear as pending devices (see The Windows Agent).
A profile is a template applied at creation time — Fortigate: Router, Cisco Catalyst, UPS: APC, Linux: Net-SNMP, and so on. The profile pre-selects the sensors and graphs that make sense for that kind of equipment, so a freshly added switch arrives with interface graphs rather than a blank page. Profiles are a starting point, not a cage; you can adjust what is tracked per device afterward.
The appliance itself appears in the inventory as a device (the local Netmon system). It is monitored like everything else — and it cannot be deleted, which is the correct fate for the one device watching all the others.
Monitoring methods
Each device is watched by one or more methods. They are independent — enable whichever combination the device supports:
| Method | What it does | Typical use |
|---|---|---|
| ICMP | Pings continuously; records reachability and latency history. | Everything with an IP address. |
| SNMP | Polls interface counters, CPU, memory, storage, temperature, and any other OID (SNMP object identifier) the device exposes. | Network gear, UPSes, printers, appliances. |
| Agent | Polls the Netmon Agent over an encrypted channel for services, processes, disks, software inventory, and Windows event logs. | Windows servers and workstations. |
| Ports | Checks that specific TCP ports accept connections. | Service-level checks: mail on 25, web on 443, RDP on 3389. |
| NetFlow | Receives flow records the device exports, extending the traffic record to segments the appliance cannot observe directly. | Routers and firewalls that can export NetFlow/sFlow. |
One data source belongs to no single device: the appliance continuously inspects the traffic on its monitored interfaces, packet by packet, all the time. Every conversation — who talked to whom, over what protocol, how much — and every minute’s protocol mix is recorded as it happens, with no configuration on the devices involved. This always-on inspection is the common spring feeding the Dashboard’s packet analyzer, the traffic on the topology map, the traffic reports, the intrusion-detection events raised against the same stream, and packet capture — which simply writes a filtered slice of it to disk. What the appliance’s interfaces can see (see Installation & First Sign-In on placement and mirror ports) sets the reach of all of them at once.
Two further data sources are device-adjacent: the syslog server accepts log messages from any device you point at the appliance, and IDS events arrive from the inspection stream above. Both land in Logs and Events, attributed to the matching device.
IPv4 and IPv6
The traffic side of the product covers both address families. The appliance’s own packet inspection reads IPv6 conversations alongside IPv4; the flow collector accepts IPv6 flow records from NetFlow v9, IPFIX and sFlow exporters; SNMP polling reads the modern neighbour table, so IPv6 neighbours are learned from switches and routers that publish them. IPv6 addresses are reverse-resolved to hostnames and, when globally routable, located by country like any other address — link-local (fe80::) and multicast (ff00::) addresses are skipped, because they have no name or location to find.
The inventory side is still IPv4. Devices are added and discovered by IPv4 address, so an IPv6-only host appears in traffic, logs and the topology map as an observed address rather than as a monitored device. A dual-stack host is monitored on its IPv4 address and its IPv6 traffic is attributed to it.
The status chips you see everywhere in the interface — ICMP Up, SNMP Down, Netflow Up — are these methods reporting individually. A device can be pingable while its SNMP credentials are wrong; the chips make that distinction visible at a glance.
Every address is a handle
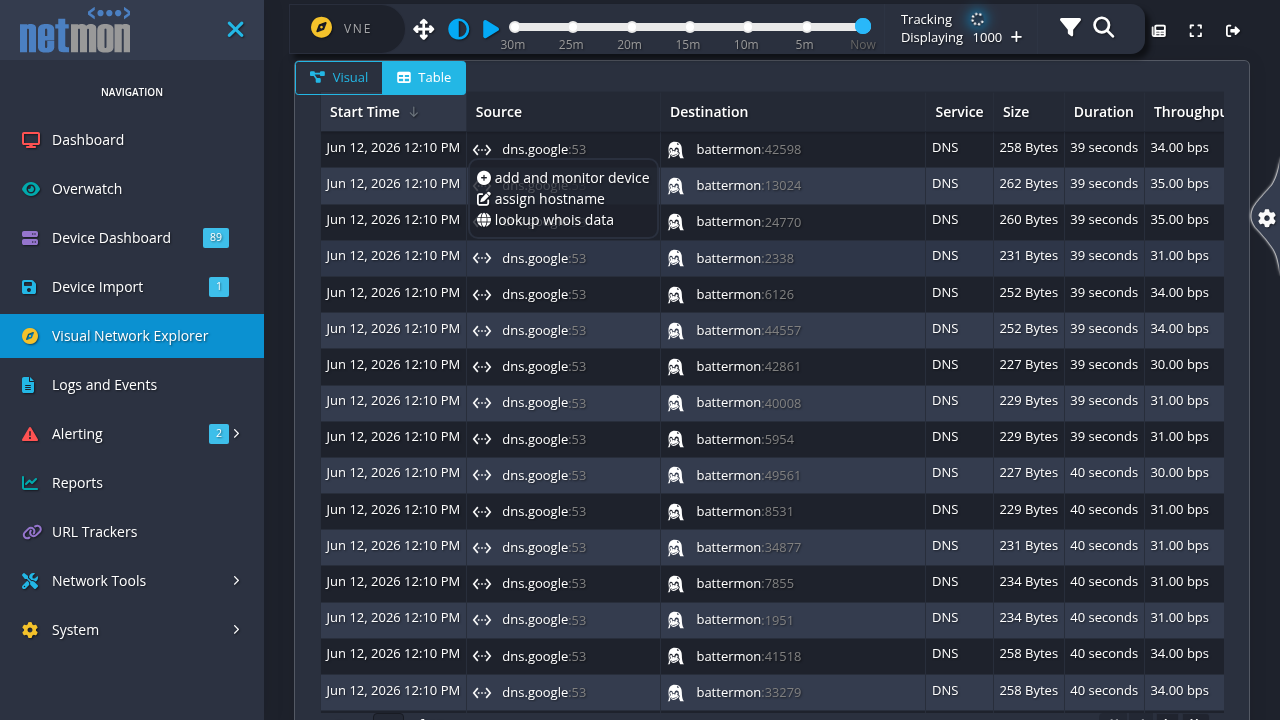
One small affordance pays for itself daily: wherever an IP address appears — a log line, a flow row, a topology table — hover over it. A popover identifies the host and offers the next step: an address on your network can be added and monitored as a device or assigned a hostname on the spot, and a remote address can be looked up with whois — owner organization, network range, and abuse contact — without leaving the page. The gap between “what is 203.0.113.40?” and an answer is one hover.
Public addresses also carry a location: a small country flag next to the address wherever it is drawn, and country, region, city and time zone in the lookup panel beside the whois result. This is why an unfamiliar address in a log line or on the topology map can usually be sized up without leaving the page. Addresses on your own network carry no flag — private, loopback and link-local space has no public location to report — so the flag itself is a quick “this one is external” signal.
Tags
A tag is a label applied to devices — Branch-Office, Printers, Core, UPS. Tags look cosmetic and start out that way (they group and filter every device list in the product), but they are load-bearing in two places:
- Alert routing. Routing rules can match on tags, so “page the network team for anything tagged
Core” is one rule, not one rule per device — and it applies automatically to core devices added next year. - User scoping. A user account can be restricted to a set of tags, after which that user sees and manages only matching devices. This is how a branch technician gets a working Netmon view of their branch and nothing else.
Tag early. A consistent tagging scheme applied while the inventory is small pays compound interest in alerting and access control later.
Users and permissions
Every person gets their own account (System → Users and Permissions). What an account can do is the sum of its permission areas — one per region of the product (Devices, Logs, Alert Center, Reports, System Settings, and so on), plus Manage Devices for changing the inventory and Super Admin for unrestricted access. The complete reference, with what each area grants and some practical role bundles, is the Permissions Reference; accounts and directory integration are configured in System Settings.
Combine permission areas with tag restrictions and the result reads like an org chart: a help-desk account with Devices + Logs scoped to Branch-12; a network engineer with everything but Users and System Settings; one or two administrators with Super Admin.
Treat Super Admin like root. Give named administrators their own accounts, keep the factory admin account’s password in the safe, and grant everyone else the narrowest set of areas that lets them work.
The monitoring services
The work is done by a fleet of always-on services inside the appliance — an ARP probe that powers discovery, the ICMP latency monitor, the SNMP and agent performance monitors, the syslog server, the flow collector, the packet analyzer, the alert monitor, and the email and webhook dispatchers, among others. System → System Settings → Services lists each one with its status and restart controls.
You rarely think about them: they start with the appliance, restart on failure, and are upgraded together with the software. The list matters when something misbehaves — confirming every service reads Running is the first diagnostic step, and the restart controls are there when support asks for one.
How the pieces fit
A single minute on the appliance ties it together: the pollers take their readings and store history; the analyzers fold in traffic, logs, and IDS events; the alert monitor evaluates everything just gathered against your alert triggers; matched events flow through routing rules to outlets — email, Slack, Microsoft Teams, Discord, or webhooks; and every chart, board, and report reads from the same history. Each later chapter is one station along that path.