
Dashboard & Overwatch v7.0.20
Netmon gives you two at-a-glance views of the whole fleet — the Dashboard you compose from live widgets, and Overwatch, which lays out every device by health automatically.
Netmon has two fleet-wide overview screens, and most teams run both: a Dashboard composed from the widgets they choose, and Overwatch as the ambient red/green wall.
The Dashboard
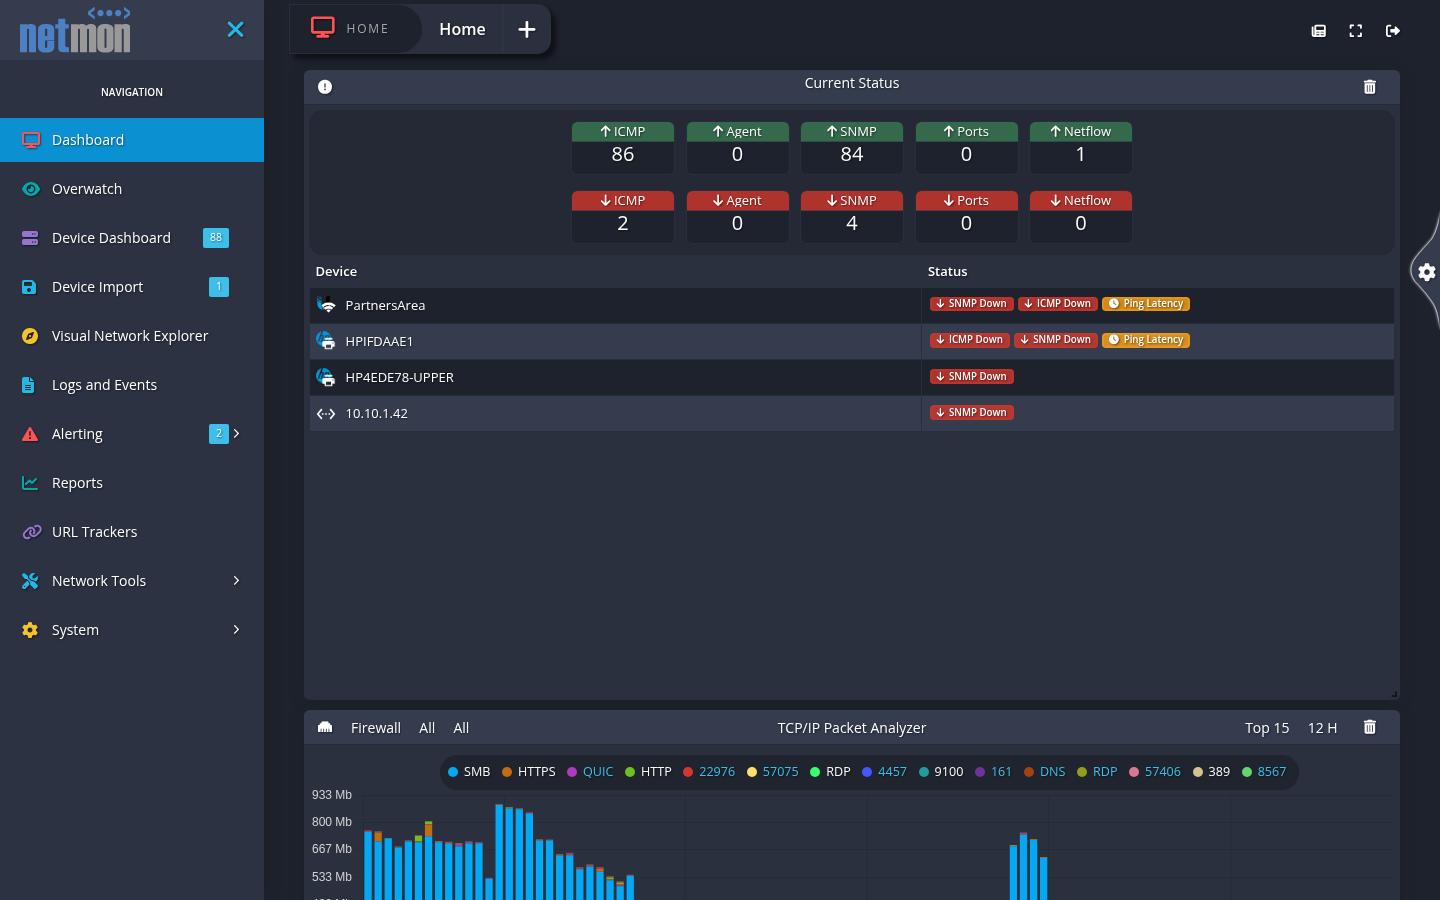
The Dashboard is your home page: one or more boards, each a grid of widgets you compose yourself. Anything Netmon can graph, count, or list can be pinned here — fleet status, a core uplink’s throughput, the top talkers on your WAN, a UPS battery gauge, recent security events. A good board answers “is everything all right?” in the time it takes to glance at it.
Boards
Boards are tabs across the top of the page. The appliance starts you with a Home board; the + tab adds more, and a board can be renamed or removed from its tab. Boards keep their layout per user, so the operations wall display, your personal triage board, and a manager-friendly overview can coexist without compromise.
A practical pattern from the field:
- Home — fleet status, problem devices, and the protocol analyzer.
- WAN — uplink throughput, firewall sessions, top talkers.
- Servers — hypervisor CPU, storage headroom, backup-job event logs.
Widgets
Each widget is a live, self-updating tile. The starter set on a new appliance illustrates the two big families:
- Current Status — counters of devices up and down per monitoring method (ICMP, Agent, SNMP, Ports, NetFlow), with a list of the devices currently in trouble and chips showing exactly what is wrong with each (
SNMP Down,Ping Latency, …). Click through to the device. - TCP/IP Packet Analyzer — the live face of the appliance’s continuous traffic inspection: a stacked, per-protocol view of what is crossing the monitored interfaces, selectable by device and time window (the Top 15 protocols over 12 H by default). Nothing has to be enabled for this data to exist — the appliance dissects its visible traffic all the time.
Beyond these, most graphs you meet elsewhere in the product — any interface graph, sensor tracker, or log view on a device dashboard — can be pinned to a board from its own context, which is how a board grows from generic to yours. Widgets rearrange by drag and resize from the corner; the trash icon removes one without ceremony. A widget’s own settings — the lookback or time window you pick in its header — are saved with the board, so it comes back the way you left it.
Boards are living documents. The strongest ones are pruned as often as they are extended — a wall display with forty tiles communicates less than one with eight.
The wall display
For a permanently visible status screen, prefer Overwatch for pure red/green coverage, and reserve a Dashboard board for the handful of graphs your team actually steers by. The fullscreen control in the top-right corner of the header strips the navigation for kiosk use.
Overwatch
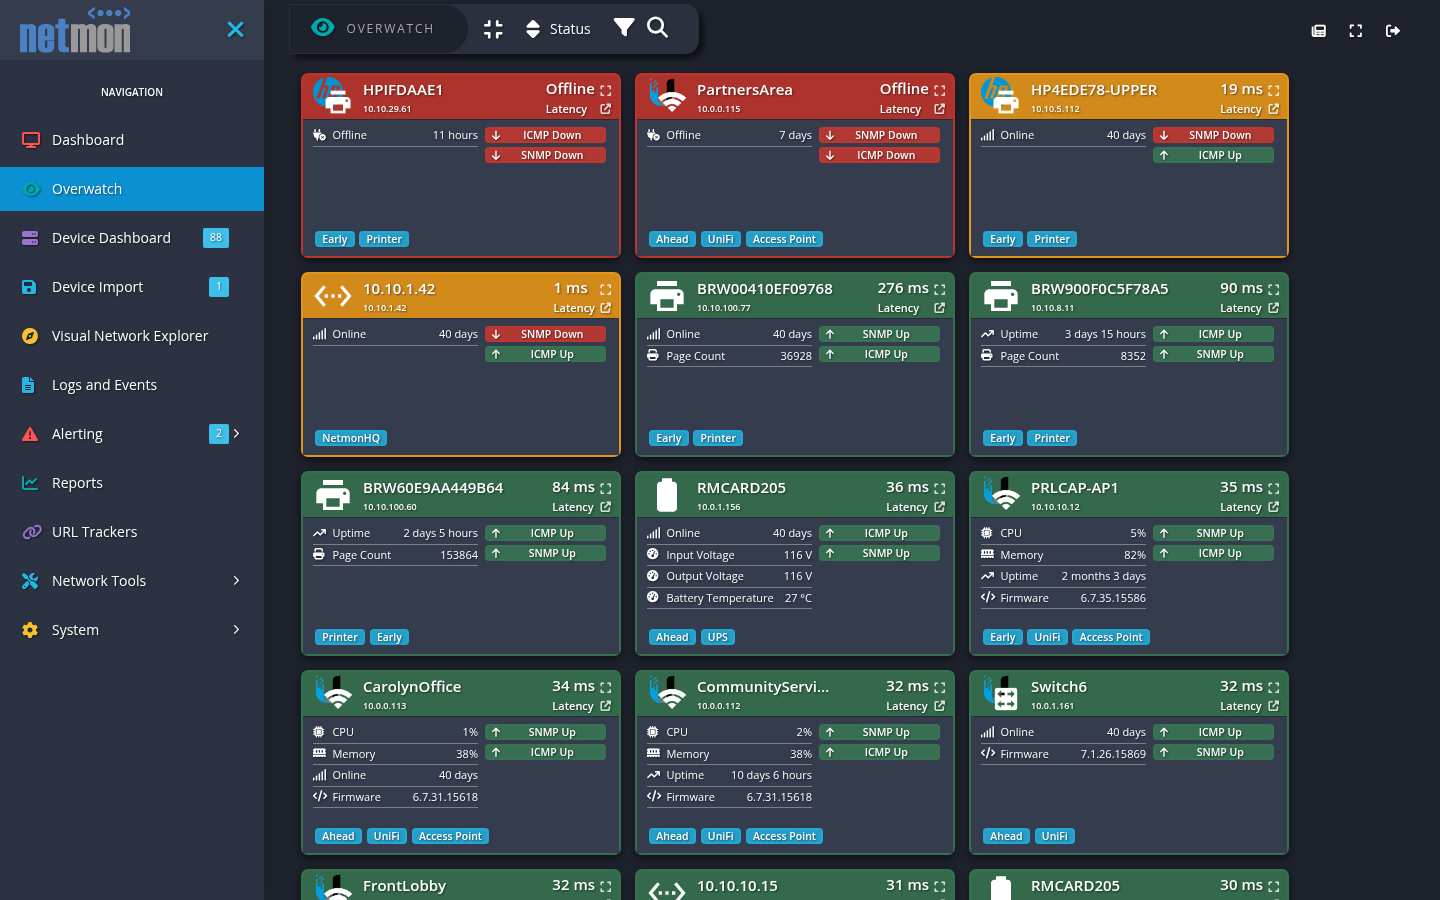
Overwatch is the whole fleet on one screen: every monitored device as a tile, colored by health, designed to be read from across a room. Where the Dashboard is composed and personal, Overwatch is automatic and exhaustive — every device is present, and a device in trouble declares itself by color and position before anyone has opened a ticket.
Reading the wall
Each tile is one device: its icon, label, and the live state of its monitoring methods. Healthy devices recede; anything down, flapping, or degraded stands out. Clicking a tile opens the device’s dashboard — the intended motion is notice on Overwatch, investigate on the device page.
The view updates continuously and needs no interaction, which makes it the natural occupant of the operations-room display. Use the fullscreen control in the header for kiosk use, and pair it with a browser session signed in as a dedicated read-mostly account (an account with only the Overwatch permission shows this page and nothing else — exactly right for a hallway screen).
If a wall display is your team’s primary trigger for action, resist the urge to also alert on everything. Overwatch carries the ambient “is everything green?” signal; reserve notifications (covered under Alerting) for conditions that should interrupt someone.