
Alerting v7.0.20
Alerting is three questions, answered in three places: what is alert-worthy, who should hear about it and where, and when to stay quiet.
Alerting is three questions, answered in three places under Alerting → Alert Manager. (One feature, two names you will meet: the page header reads Alert Manager, and the permission that gates it is named Alert Center — both name the same place.)
- What is alert-worthy? — Alert Triggers: the conditions Netmon evaluates.
- Who should hear about it, and where? — Alert Routes and Alert Outlets: rules that match fired alerts and the destinations they deliver to.
- When should we stay quiet? — Alert Exceptions: maintenance windows that suppress matched alerts on schedule.
Separating these is the design’s central kindness: triggers describe conditions once; routing decides recipients centrally. There are no per-alert recipient lists to maintain, so a personnel change is one routing edit — not an audit of every alert in the system.
Alert routing is new in this release, and if you are upgrading it is the change to absorb first. In every prior version, an alert and its recipients were a single object — each alert carried its own email list, and email was the only way out. Version 7.0.20 separates the two: what fires lives on the Triggers tab, who hears about it lives in Routes and Outlets — and outlets now reach beyond email to webhooks, Slack, Microsoft Teams, and Discord, all new in this release.
Your existing alerts survive the change untouched. They appear on the Triggers tab with a Legacy badge in the Source column — “legacy” means an alert born under the old model, attached directly to a device or tracker. The upgrade created a matching route for each one, so notification behavior carries over — but those notifications now flow through the same routes and outlets as everything else, where you can see, edit, and extend them. Alerts created by the New Alert wizard (the log-stream classes) are the modern family; operationally the two differ only in how they are defined — routing treats them identically.
Alert Triggers
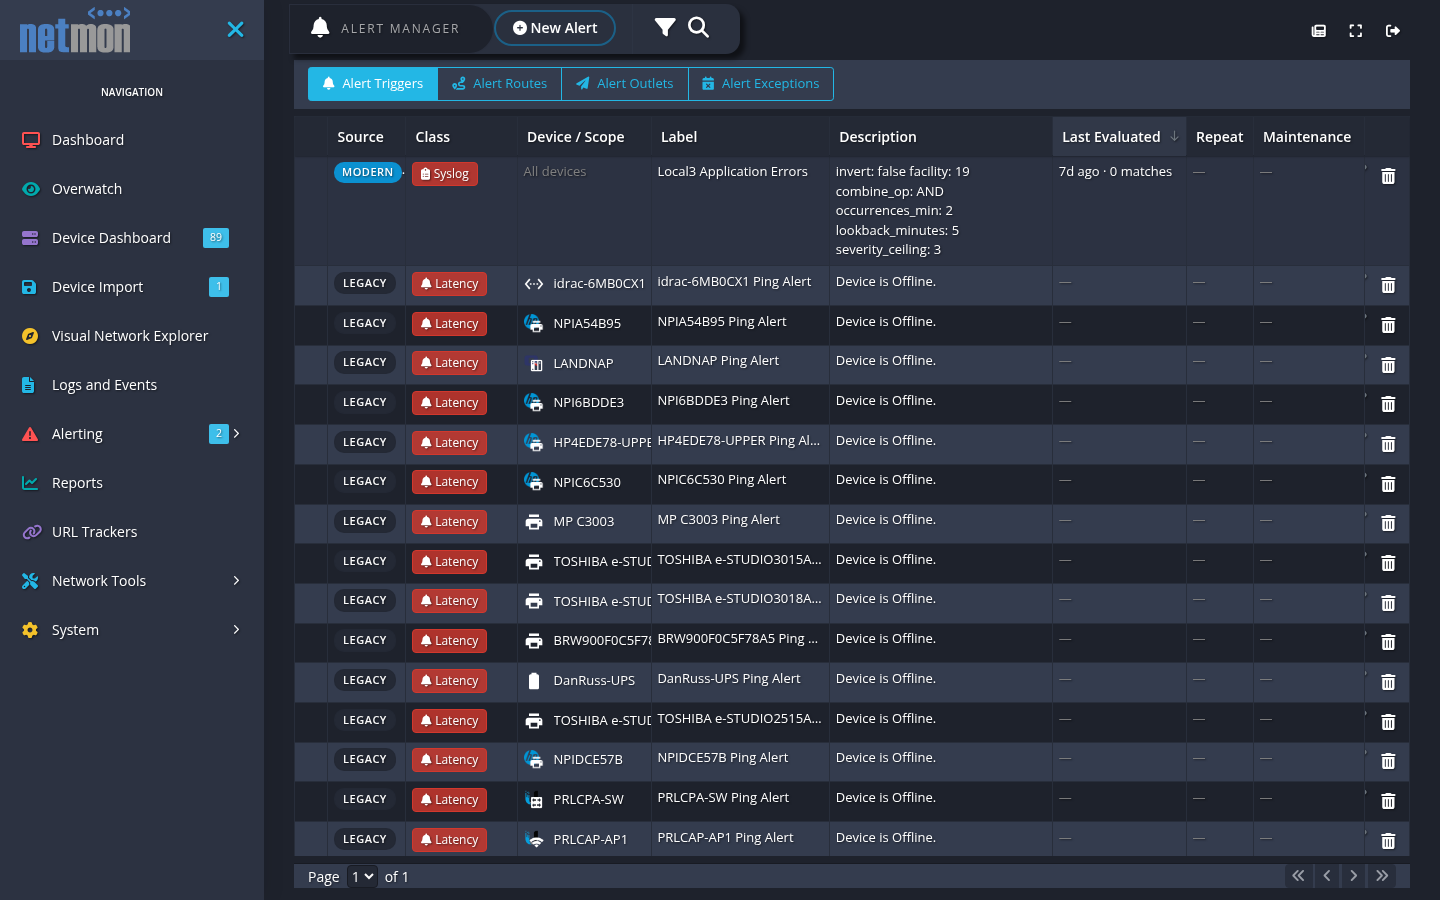
The Triggers tab lists every alert definition with its source (legacy or modern, as above), class, scope, label, evaluation status (when it last ran and what it matched), repeat behavior, and a maintenance indicator. Two families coexist:
- Device-status alerts are the classics, attached to devices and their trackers: device offline, ping latency, SNMP value out of bounds, disk filling, interface state, port closed, website down. Most arrive automatically with sensible defaults when devices are imported — a new device is born with its offline alert.
- Log-stream alerts (the New Alert wizard) watch the collected streams: Syslog, Windows Event Log, and IDS Events. Each is defined by a class-specific filter — facility/severity/text for syslog; source, event IDs, severity for event logs; addresses, ports, severity for IDS — plus an occurrence threshold and lookback window (“alert when this matches ≥ 5 times in 10 minutes”). Pick the class, fill the filter, choose which devices it watches, set label and severity, done: the wizard is four steps — Alert Class, Parameters, Scope, Finalize.
Every trigger carries a severity; device-status triggers add throttle settings that suppress repeat noise while a condition persists. Log-stream triggers have no such settings and need none: each new match notifies exactly once — the same entry is never re-sent, and there is no reminder and no “resolved” message, because a log line is an event rather than a state. Triggers can be disabled without deletion — the kill switch for a misbehaving alert at 2 a.m.
Choosing what an alert watches
A device-status alert is attached to a device by definition. A log-stream alert is not, so the wizard’s Scope step asks the question directly: should this alert watch Everything, A specific device, or Devices with tags? Tags combine with AND — a device has to carry every tag you pick. Whatever you choose is shown back on the Triggers tab in the Device / Scope column, as All devices, a device, or tag chips.
Narrow the scope when a condition is only meaningful for part of the fleet — a Windows event ID that matters only on domain controllers, a syslog pattern only your firewalls emit. A device outside the scope never fires the alert at all: nothing is recorded in Alert History for it, and no route is ever consulted. Leave it on Everything when the condition matters everywhere; that is the default, and it is where every alert that predates this release stays.
Scope decides where an alert fires; a route’s scope decides who hears about it. They are separate settings answering separate questions — an alert scoped to one device still reaches every recipient its matching routes name, and a route scoped to one device cannot stop a fleet-wide alert from firing elsewhere.
How severity is numbered
Netmon alert severity runs 1 to 5, with 1 the most severe: 1 Critical, 2 High, 3 Normal, 4 Low, 5 Info. Routes filter by selecting the severities they care about — a route for the serious stuff selects severities 1 and 2.
One source-specific scale to keep straight: the syslog protocol has its own severity numbering, 0 (Emergency) through 7 (Debug) — also lower-is-worse. A syslog trigger’s severity ceiling uses that scale and matches entries at or more severe than the chosen level: a ceiling of 3 (Error) matches Error, Critical, Alert, and Emergency, and ignores Warning and milder. Windows event-log triggers filter on Windows’ own levels (Critical, Error, Warning, Information) by the same at-least-this-severe logic.
Tuning a device-status alert
The everyday edit — tightening a latency threshold, relaxing a disk percentage — starts from the device dashboard: each tracked reading’s row carries its alerting controls (the bell icon), which open that reading’s alert settings — threshold, severity, repeat, and throttle. The Triggers tab is the fleet-wide view of the same definitions. Changes take effect at the next evaluation; no restart, no re-routing — routes match the alert, not its threshold.
Alert Outlets
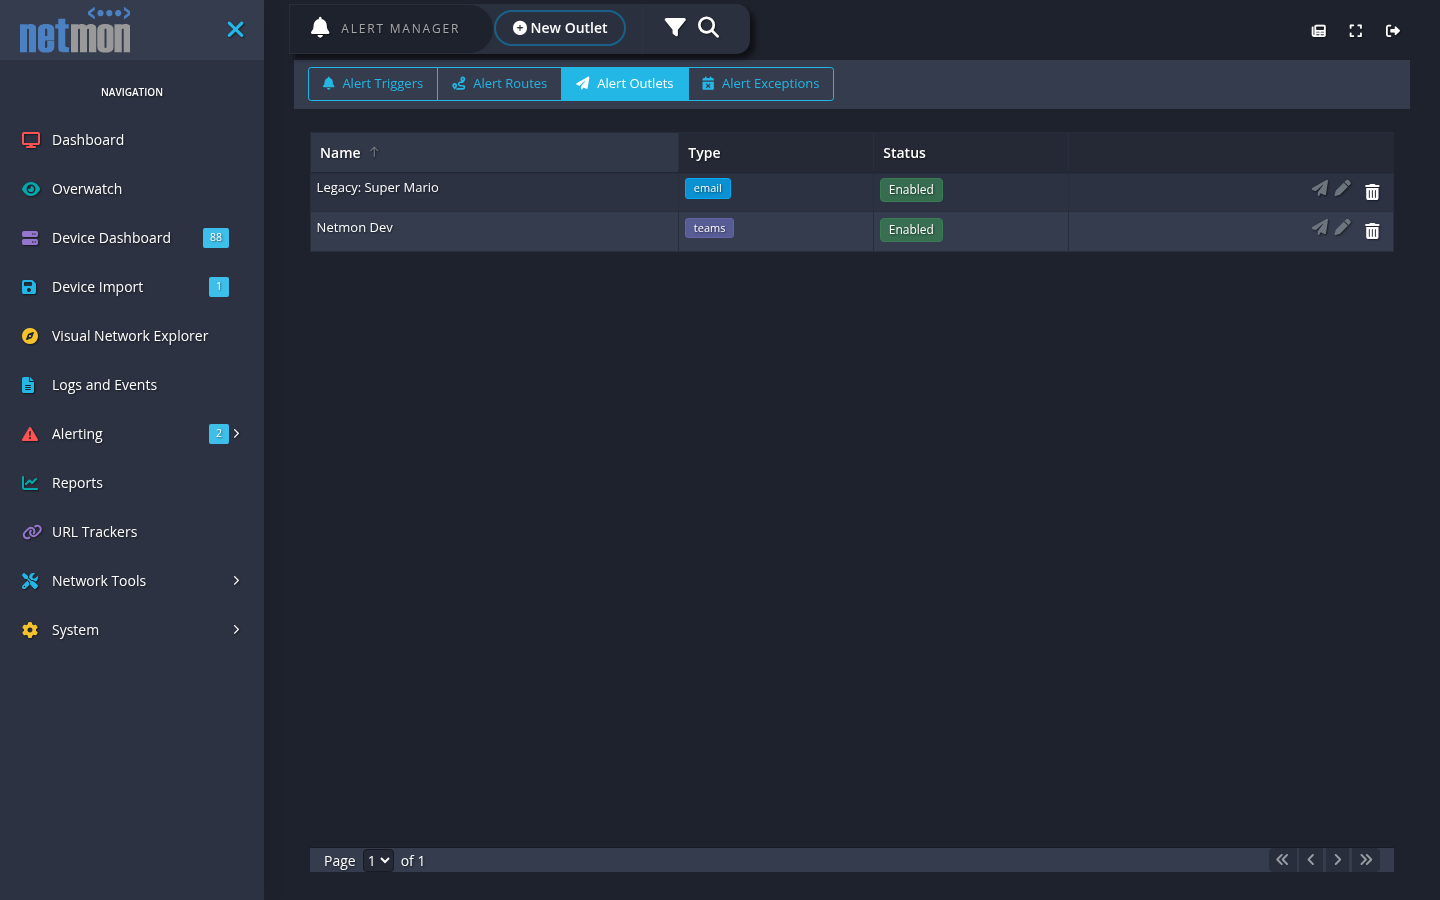
An outlet is one configured destination. Email was the only transport in earlier releases; the rest of this list is new in 7.0.20:
- Email — recipient set, delivered via your SMTP configuration.
- Webhook — an HTTP endpoint receiving a JSON payload you can shape with payload templates.
- Slack / Microsoft Teams / Discord — native messages via each service’s incoming-webhook URL.
Create outlets once, name them well (netops-email, noc-teams, pagers-webhook), and let routing reuse them. Secrets in outlet configurations (webhook URLs, credentials) are stored encrypted and masked on read.
Alert Routes
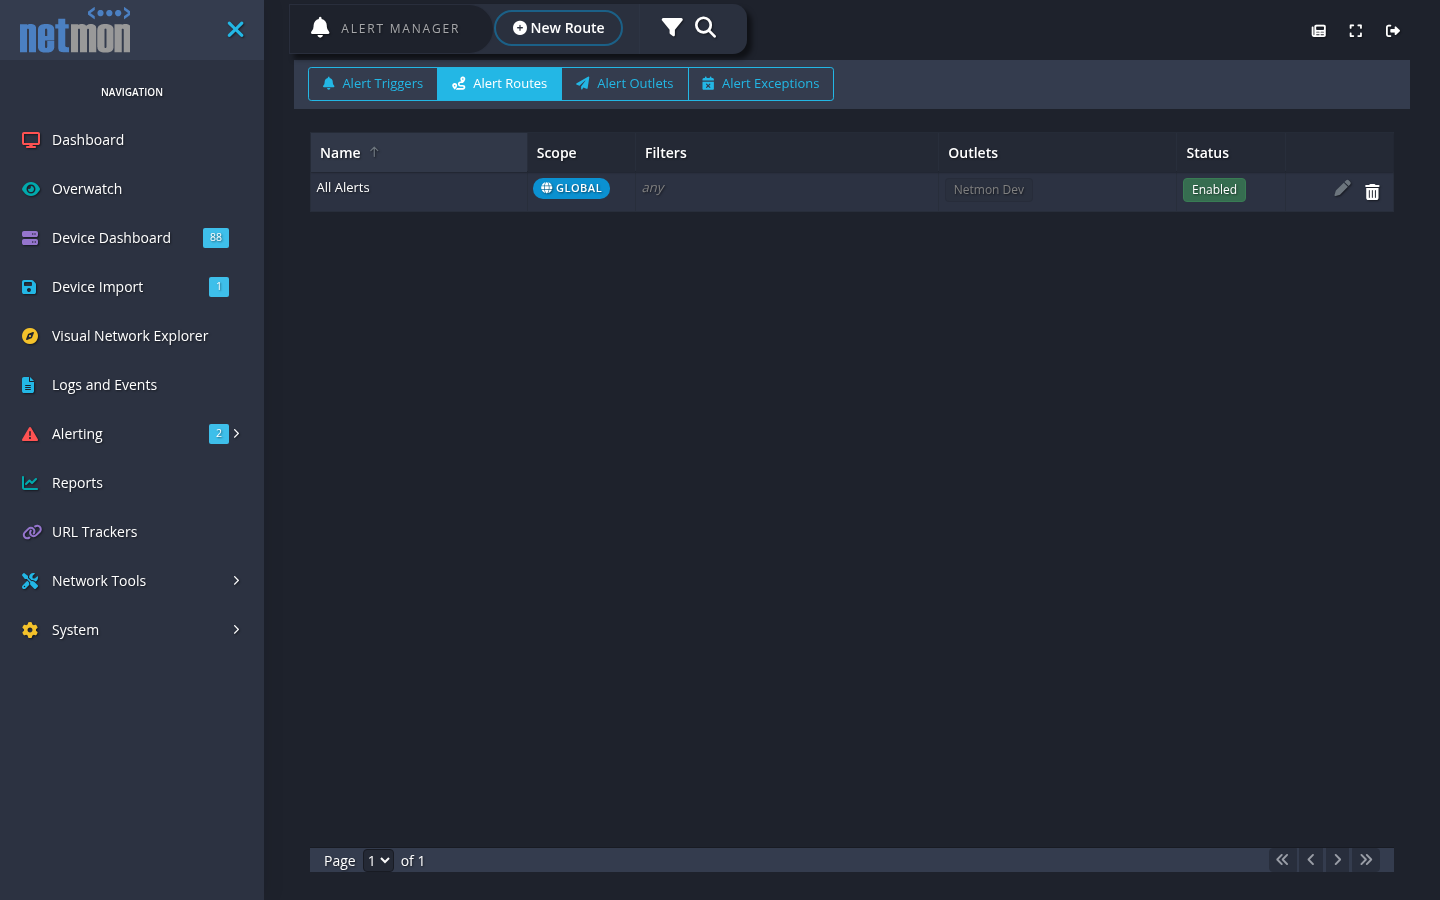
Routes are the switchboard. Each route has a scope (everything, one device, one specific trigger) plus optional filters — alert class, severity, and device tags — and a list of outlets to deliver to.
Routing is additive: every route that matches a fired alert contributes its outlets, and the union is delivered. A global “email the NOC for everything” route and a specific “Teams-ping the firewall channel for Fortigate-tagged criticals” route both fire on a Fortigate outage — the specific rule never silences the general one.
Three routes cover most organizations:
- Everything, severities 1–3 (Critical through Normal) →
netops-email. - Tag
Core, all severities →noc-teams+pagers-webhook. - Class IDS Events, severities 1–2 →
security-email.
Alert Exceptions
An exception is a recurring quiet window — today that means maintenance windows. While one is active, alerts matched by whatever it is attached to are suppressed: evaluated and recorded, but not delivered. The record survives; the Sunday-evening page does not.
Walk through a typical one — a monthly maintenance window on the third Sunday, 5 p.m. to 10 p.m.:
- On the Alert Exceptions tab, press New Alert Exception.
- Label it something a colleague will recognize in a list:
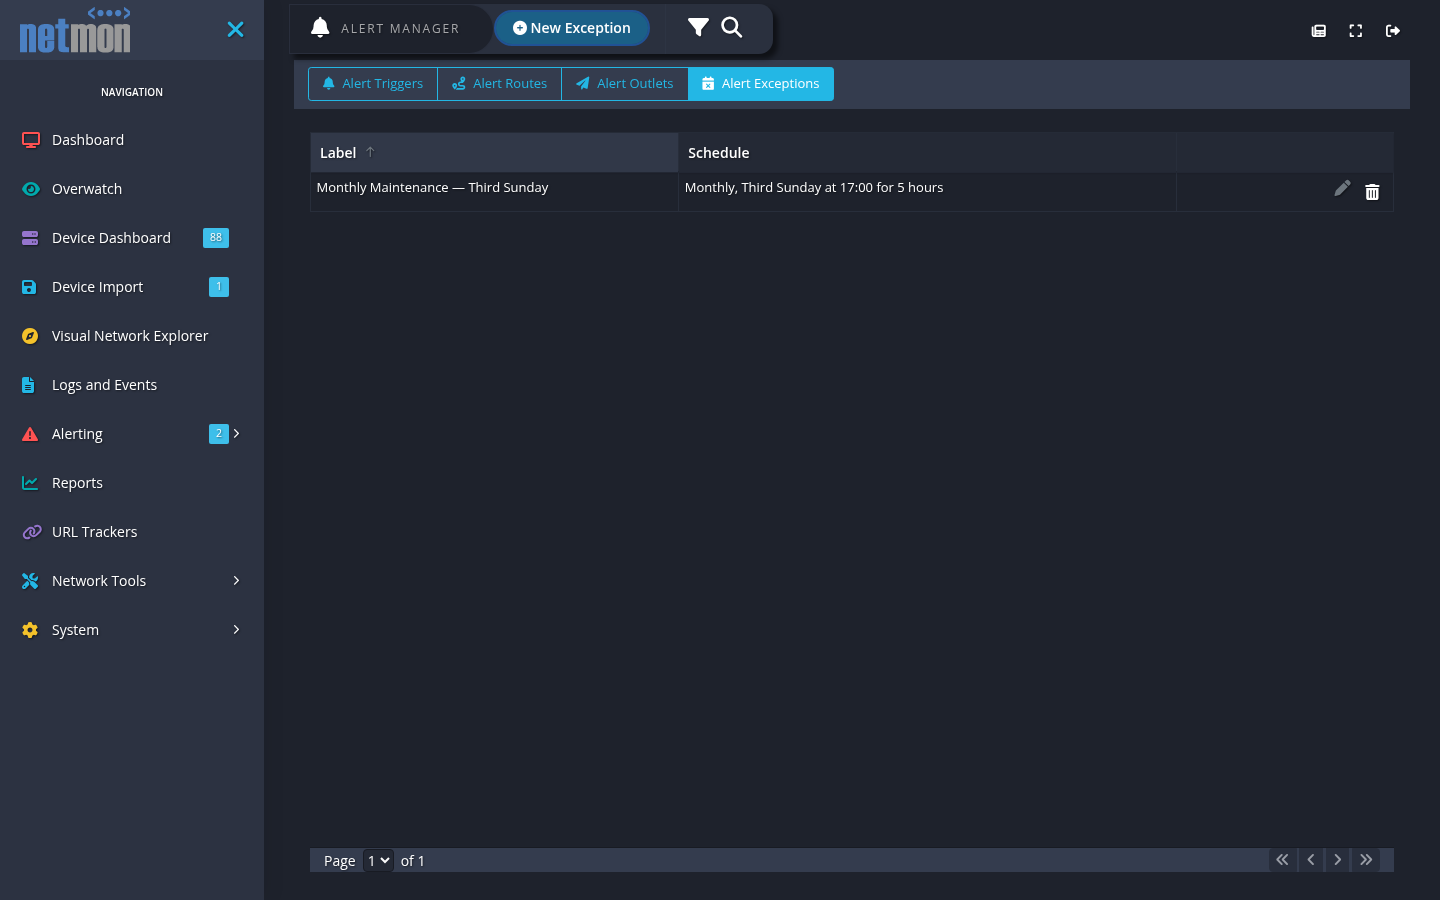
Monthly Maintenance — Third Sunday. - Recurrence: choose Monthly, Day of Week, then Sunday and Third. (Daily, weekly, and day-of-month patterns cover the other common shapes.)
- Hour:
17:00. Duration:5hours — the window ends at 22:00. - Press Create Exception.
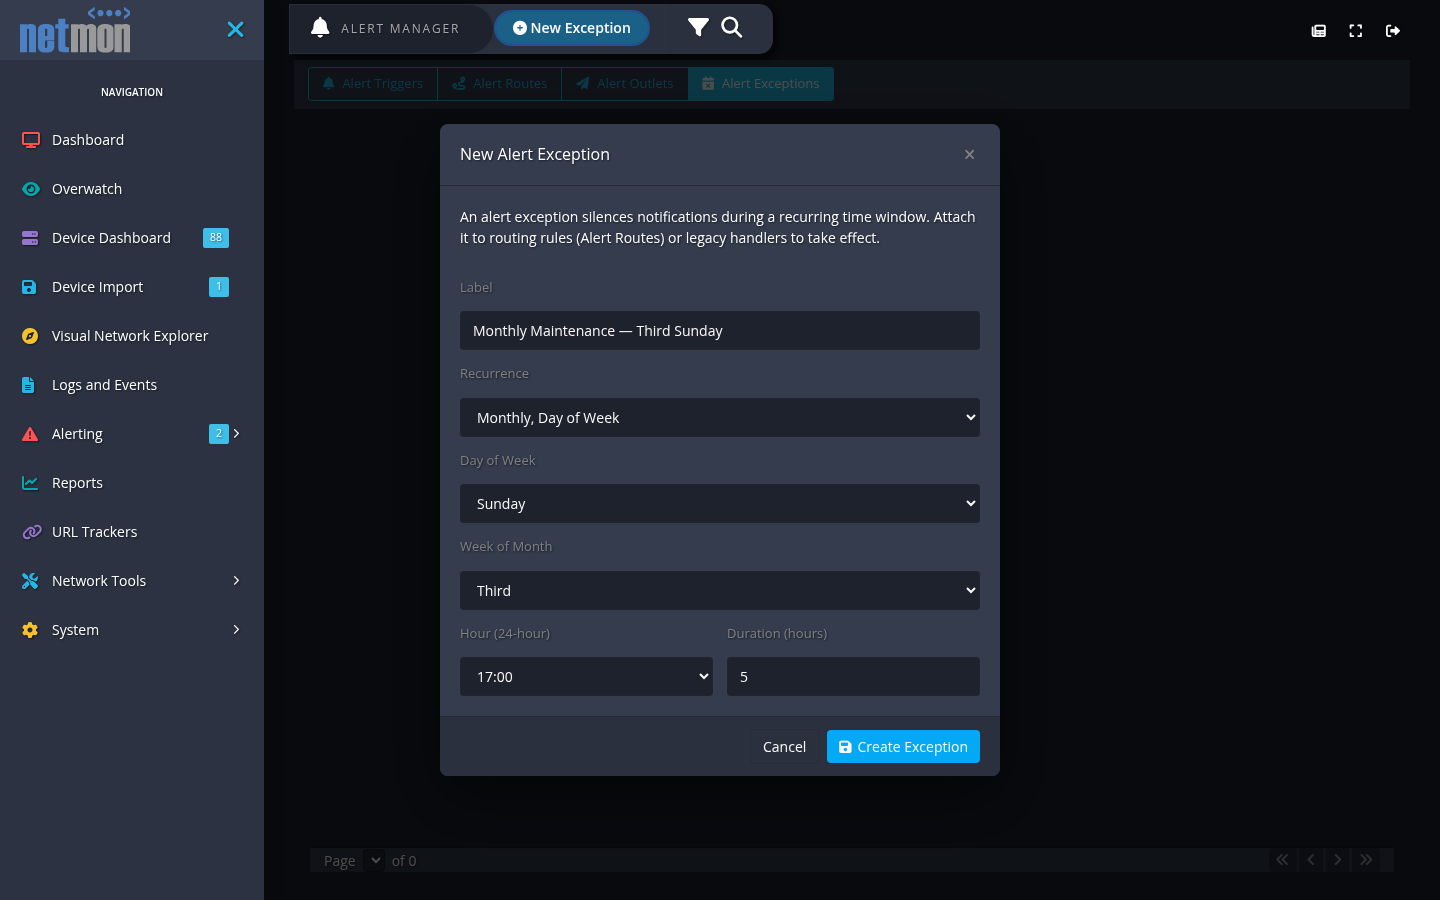
The new exception appears with its schedule spelled out in plain language:
An exception does nothing until it is attached: edit the routes (or legacy alerts) it should quiet and select it there. That direction of attachment is deliberate — you choose which notification paths fall silent during the window, rather than silencing the appliance wholesale. Anything not attached keeps alerting right through your maintenance evening, which is exactly what you want for the equipment you are not working on.
Templates and history
Alerting → Template Editor (the page is titled Email Templates) holds the message bodies, with separate tabs for the modern log-stream classes and the device-status classics.
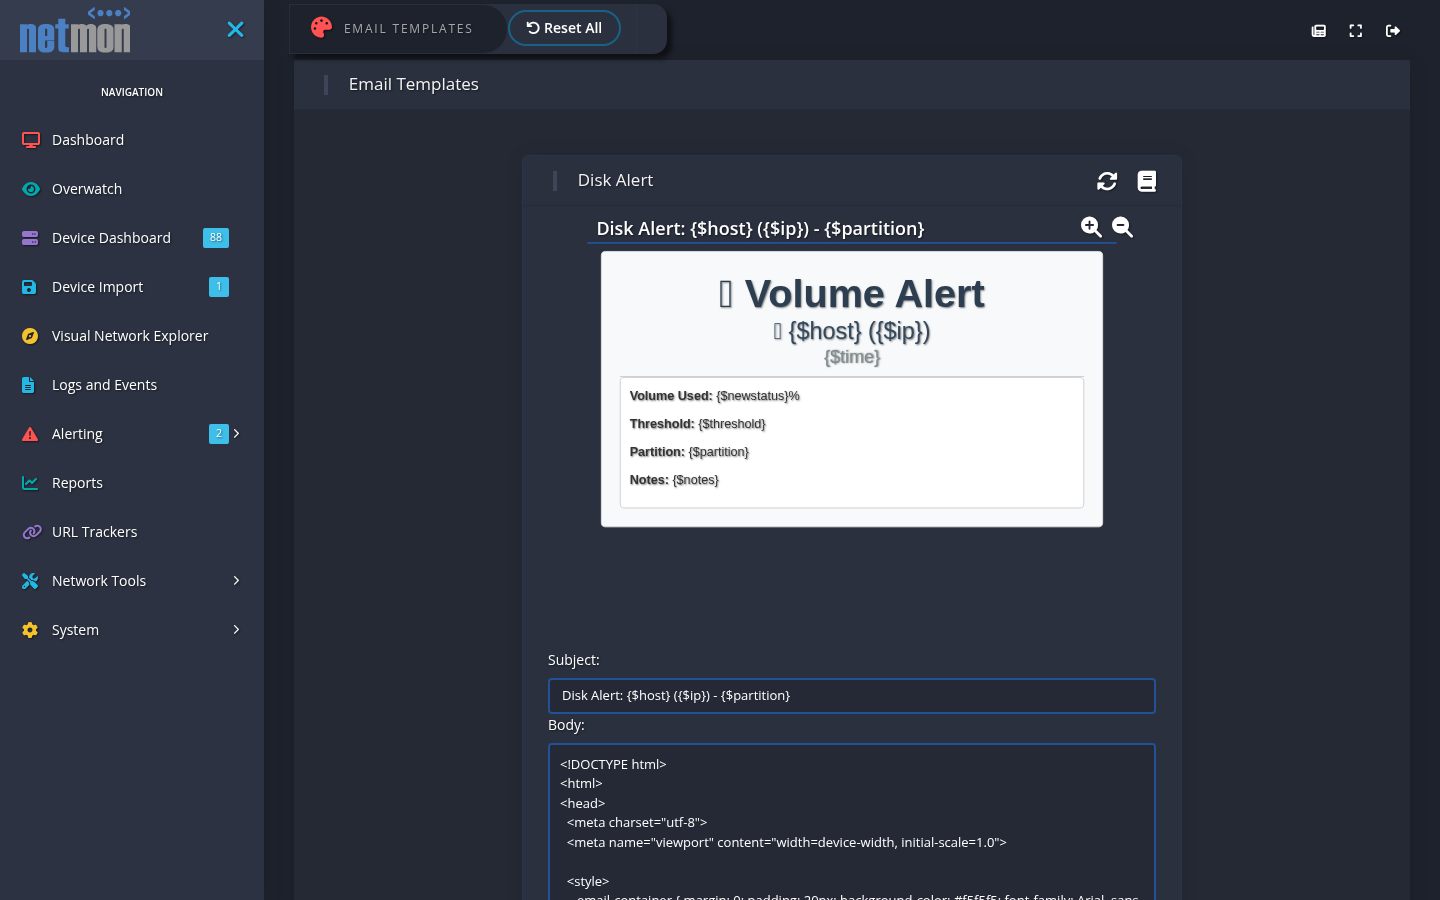
Templates substitute live event fields (device, severity, message, time — see the appendix for the variable reference) so you can match house style or a ticketing system’s inbound parser. Webhook payload templates live with their outlets.
Alerting → Alert History is the ledger: every alert that fired, when it triggered, reminded, and resolved, and what was delivered where — including alerts that fired during a maintenance window and deliberately went nowhere. When someone asks “did we get told?”, this page is the answer.
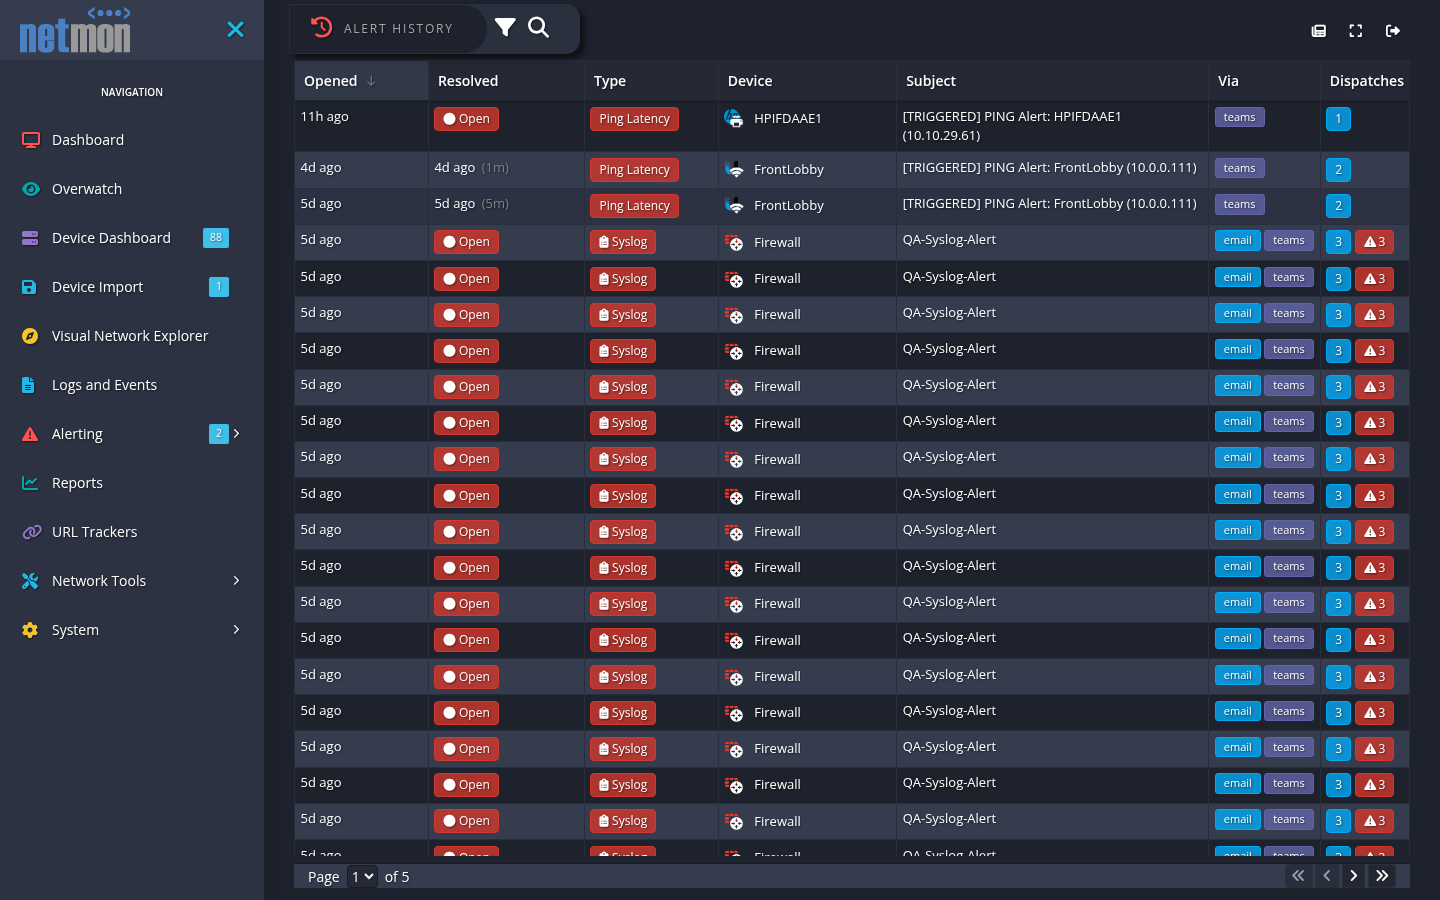
Test the path end-to-end once per quarter: pick a lab device, pull its cable, and watch the alert traverse trigger → route → outlet to a real inbox or channel. Alerting configurations rot silently — SMTP passwords expire, webhook URLs are rotated — and the history page makes the delivery failure visible before an outage does.