
Reports & URL Trackers v7.0.20
Turn the history Netmon already collects into documents for the people who never open a dashboard, and watch the web endpoints your organization depends on from the appliance’s vantage point on your network.
Reports and URL Trackers share a foundation: history Netmon is already keeping. Reports package it into printable documents; URL Trackers watch the web endpoints your organization depends on and give each one the same kind of history a device enjoys.
Reports
The Reports page turns collected history into documents: availability and latency summaries, interface utilization, traffic breakdowns, inventory listings. Reports serve the audiences who will never open a dashboard — management, auditors, customers — and the questions that span weeks rather than minutes.
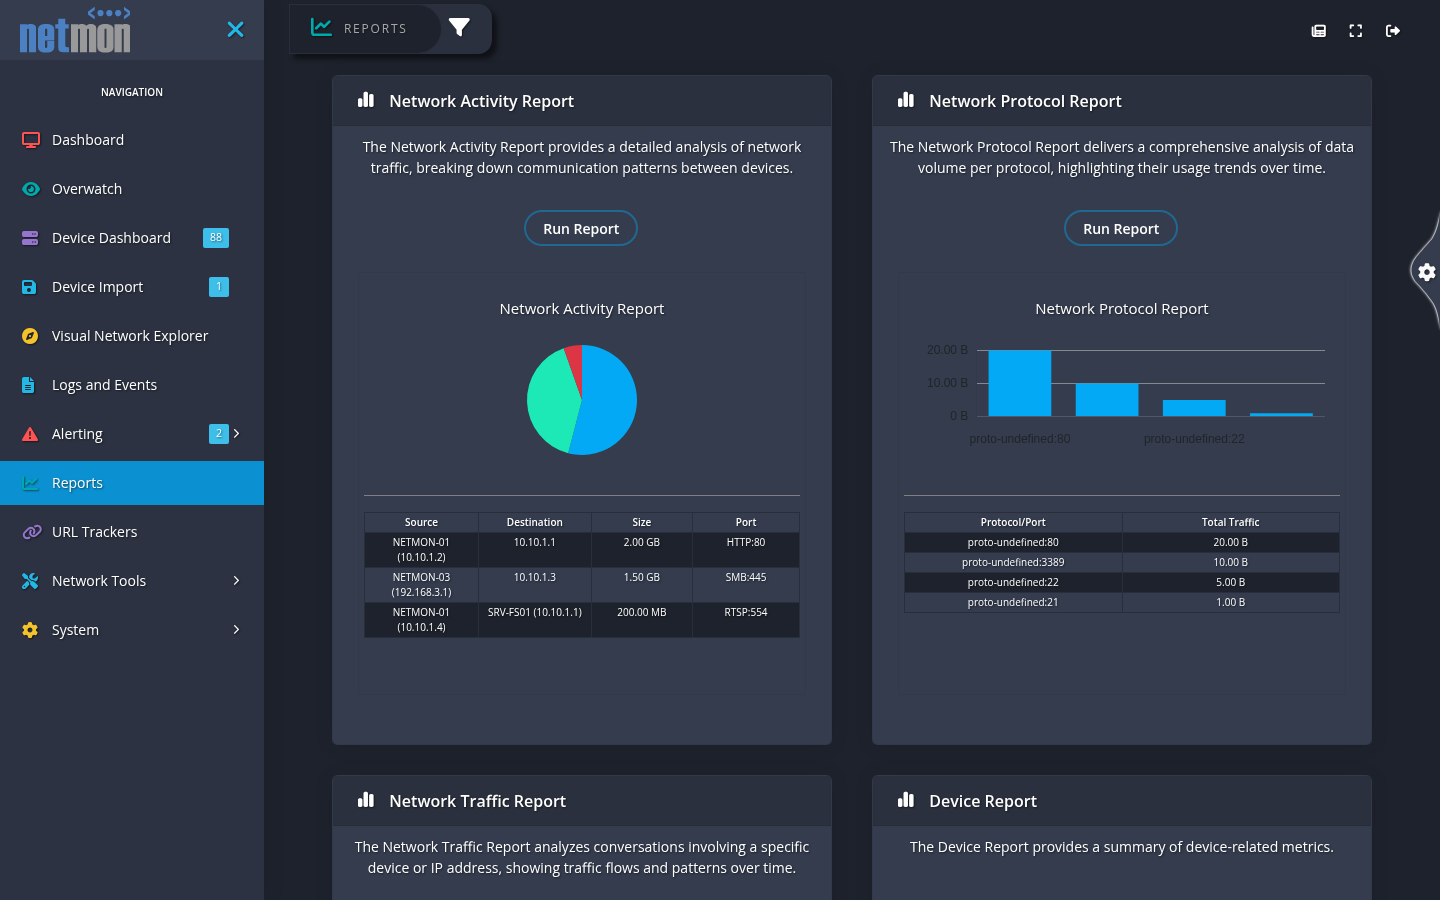
Building a report
A report definition is a template plus scope plus range: pick the report type, narrow it to the devices it should cover (everything, a tag, or a hand-picked set), set the time window, and press Run Report. The catalog covers the recurring questions: traffic (Network Traffic, Network Activity, Network Protocol), availability (Up/Down, Latency), inventory and capacity (Device, Disk and All Disks, Interface and All Interfaces, Performance Tracker), service checks (TCP Service), and website availability (URL). Reports run on demand — there is no background scheduler — and the result renders in the browser, ready to print or save.
Generated reports are not lost when you navigate away: the Report Manager on the same page keeps what you have produced, so last quarter’s edition is recalled, not regenerated, and can be renamed or removed when it is no longer needed.
Reports respect tag scoping like the rest of the product — a user restricted to Branch-12 reports on Branch 12.
Traffic reports
The traffic reports deserve a special mention. They draw on the appliance’s continuous traffic record — its own round-the-clock packet inspection, extended by any flow export you have configured — so they answer the recurring bandwidth questions from evidence that was being collected whether or not anyone planned to ask: top talkers, top protocols, busiest hours, who consumed the WAN last Tuesday. They accept any address on your network as a subject, monitored device or not, because the traffic record is observational.
The Network Protocol report is an IP-layer view. It covers every IP protocol — including the ones with no port number, such as GRE, ESP, OSPF and VRRP, which appear under their protocol name — but not non-IP frames like ARP, STP or LLDP. Its totals are therefore slightly below an interface’s measured throughput, by design; use the Interface report when you need the number the link actually carried.
A report can only reach as far back as retention keeps the underlying data (see Data Maintenance). If a yearly report matters, confirm the relevant data families are retained for a year — before December.
URL Trackers
URL Trackers watch the web endpoints your organization depends on — public sites, intranet applications, vendor portals, API health endpoints — from the appliance’s vantage point on your network. Each tracker fetches its URL on an interval and records reachability, response time, and the response itself, building the same kind of history a device enjoys.
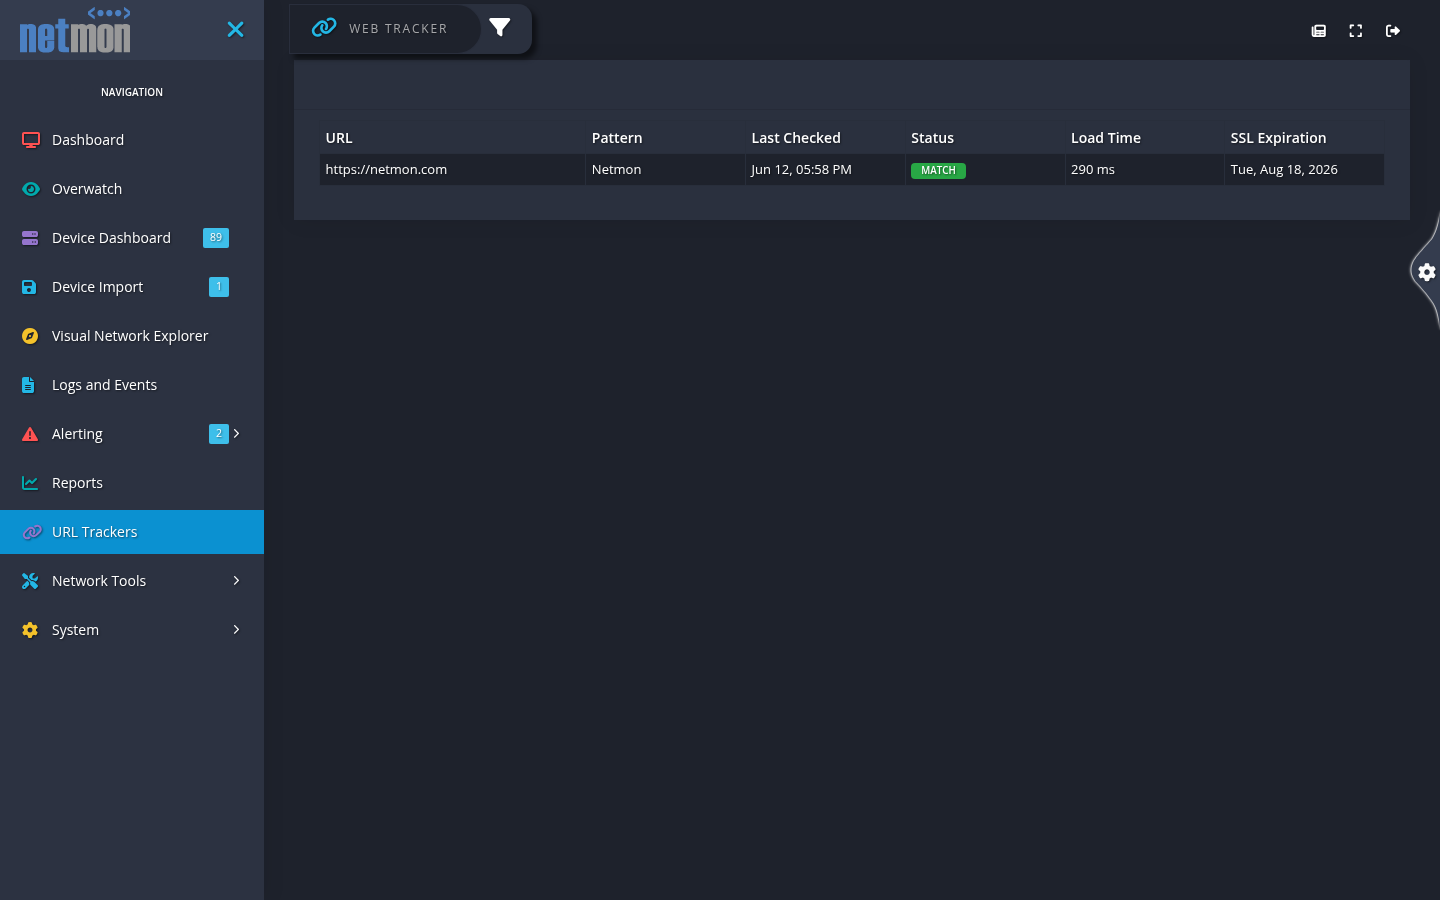
Creating a tracker
Add a tracker with a label, the URL, and a check interval (180 seconds by default). Two optional checks deepen it: a Pattern — text the fetched page must contain, which catches the site that answers 200 with an error page — and SSL expiration tracking, which records how long the site’s certificate has left. The tracker’s detail view shows its status timeline and response-time graph; failures state what went wrong (connection refused, timeout, unexpected status, missing pattern), which usually decides the first diagnostic step before anyone opens a terminal.
Two habits make trackers genuinely useful:
- Track what users type, not just what infrastructure serves — the public hostname through the load balancer, not only the backend. The difference between the two failing is itself diagnostic.
- Track the dependency, too. The payroll provider’s login page on a tracker turns “the portal is down for everyone or just us?” into a recorded fact.
URL failures feed alerting like any device condition — a route can mail the web team when a tracked site goes dark, with the same maintenance windows available for planned deploys.
Trackers fetch pages regardless of certificate state, by design — a site limping on an expired certificate is exactly the situation you want measured rather than ignored. The certificate is not ignored, though: its expiration is tracked alongside the fetch, so “the cert dies in nine days” is a recorded fact you can alert on rather than a surprise.