
Network Tools & Packet Capture v7.0.20
Run ping, traceroute, MTR, SNMP walk, port scan, and throughput tests from the appliance itself, and capture packets straight off its monitored interfaces — no separate tap, no SSH session, no tcpdump syntax.
Two features share the same idea: the appliance is a better vantage point than your desk. The Network Tools menu runs the standard diagnostics from where the monitoring lives, and Packet Capture writes a filtered slice of the traffic Netmon is already inspecting to standard capture files.
Network Tools
The Network Tools menu collects the diagnostics every network administrator reaches for — run from the appliance, which is the point. Your workstation’s traceroute describes your desk’s view of the problem; the appliance’s describes the monitoring system’s view, from the same vantage that produced the alert you are chasing. Each tool page carries the device picker, so “run this against that device” is two clicks.
The set:
- Ping — reachability and round-trip time, the first question asked of anything.
- Traceroute — the path packets take, hop by hop.
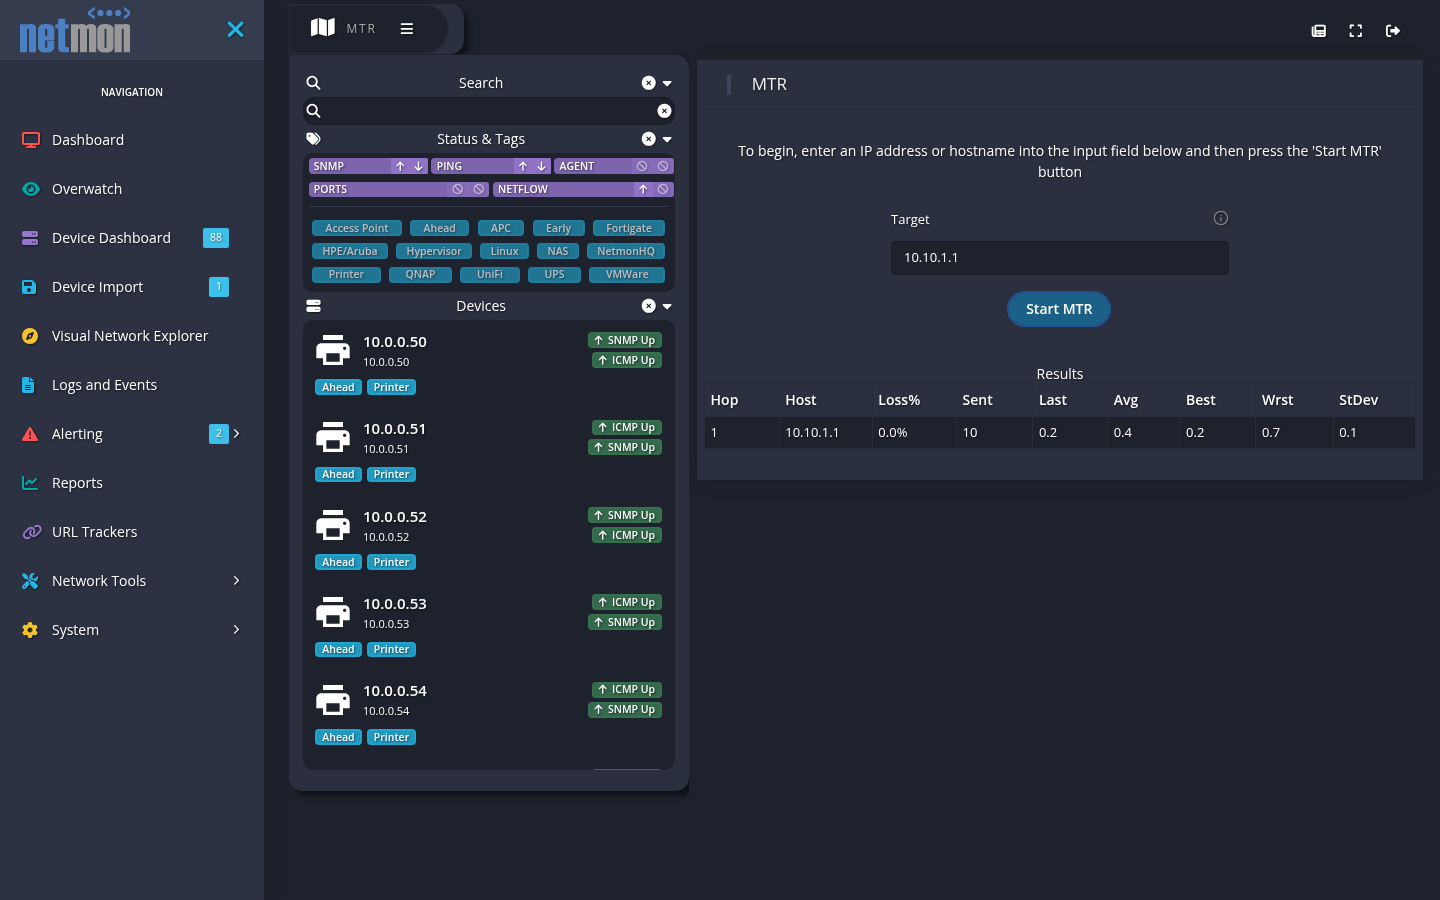
- MTR — traceroute and ping combined and repeated: per-hop loss percentage and latency statistics (sent, last, average, best, worst, standard deviation) that separate “the WAN is lossy” from “hop four is lossy”. Give it a minute to accumulate cycles; the statistics are the product.
- SNMP Walk — interrogate a device’s SNMP tree directly with stored or ad-hoc credentials. The honest answer to “is the device exposing this value, or is Netmon failing to read it?”
- Port Scan (Portscan in the menu) — which TCP ports answer on a host. Useful both for building port checks and for noticing what shouldn’t be listening.
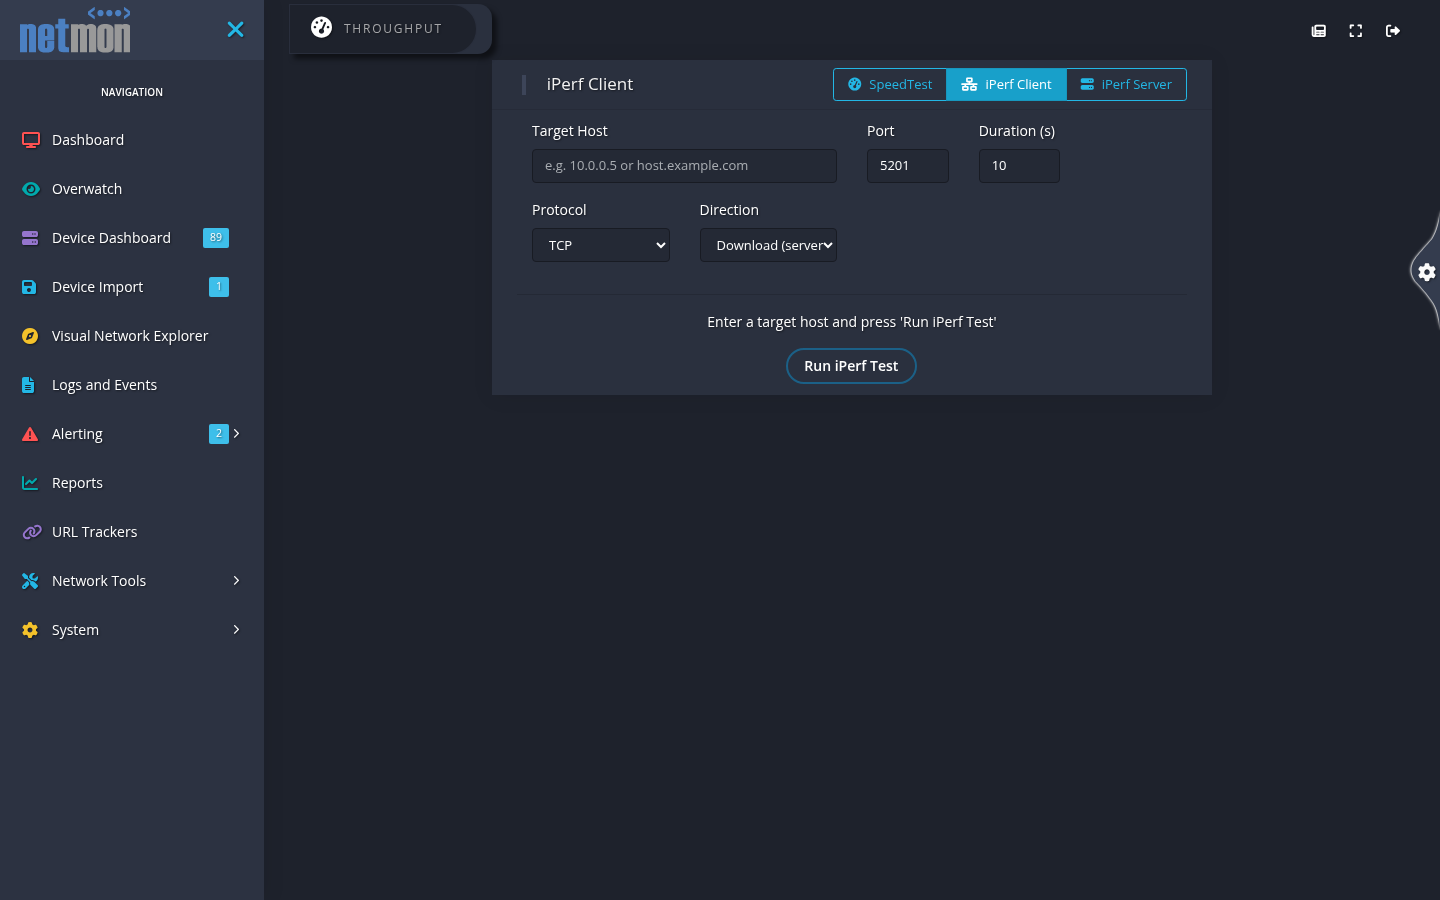
- Speed Test (labeled Throughput in the menu) — throughput measurement from the appliance. Three modes share the page: an internet Speed Test for qualifying a circuit or settling an argument with a carrier, and iPerf Client / iPerf Server for point-to-point throughput tests between the appliance and another endpoint (another Netmon, or any iPerf host). A run-history sidebar keeps past results.
The browser-based System Terminal is not a diagnostic tool but appliance administration: it lives under System (not in this menu), requires the System Settings permission, and is covered in System Settings.
Results reflect the appliance’s network position. A path that differs from your desk’s path is not an error — it is frequently the clue.
Packet Capture
When graphs and logs run out, packets settle it — and Netmon is already holding them. The appliance inspects the traffic on its monitored interfaces continuously; that always-on stream is what the packet analyzer, the topology map, and the IDS feed are made from. A packet capture does not switch anything on: it asks the running engine to write a filtered slice of what it is already seeing to disk, as standard .pcapng files that open in Wireshark and every other capture tool. No separate tap appliance, no SSH session, no tcpdump syntax — and no spin-up gap while the interesting packets go by.
Creating a capture
From Network Tools → Packet Captures (or directly from a device’s context in the Visual Network Explorer):
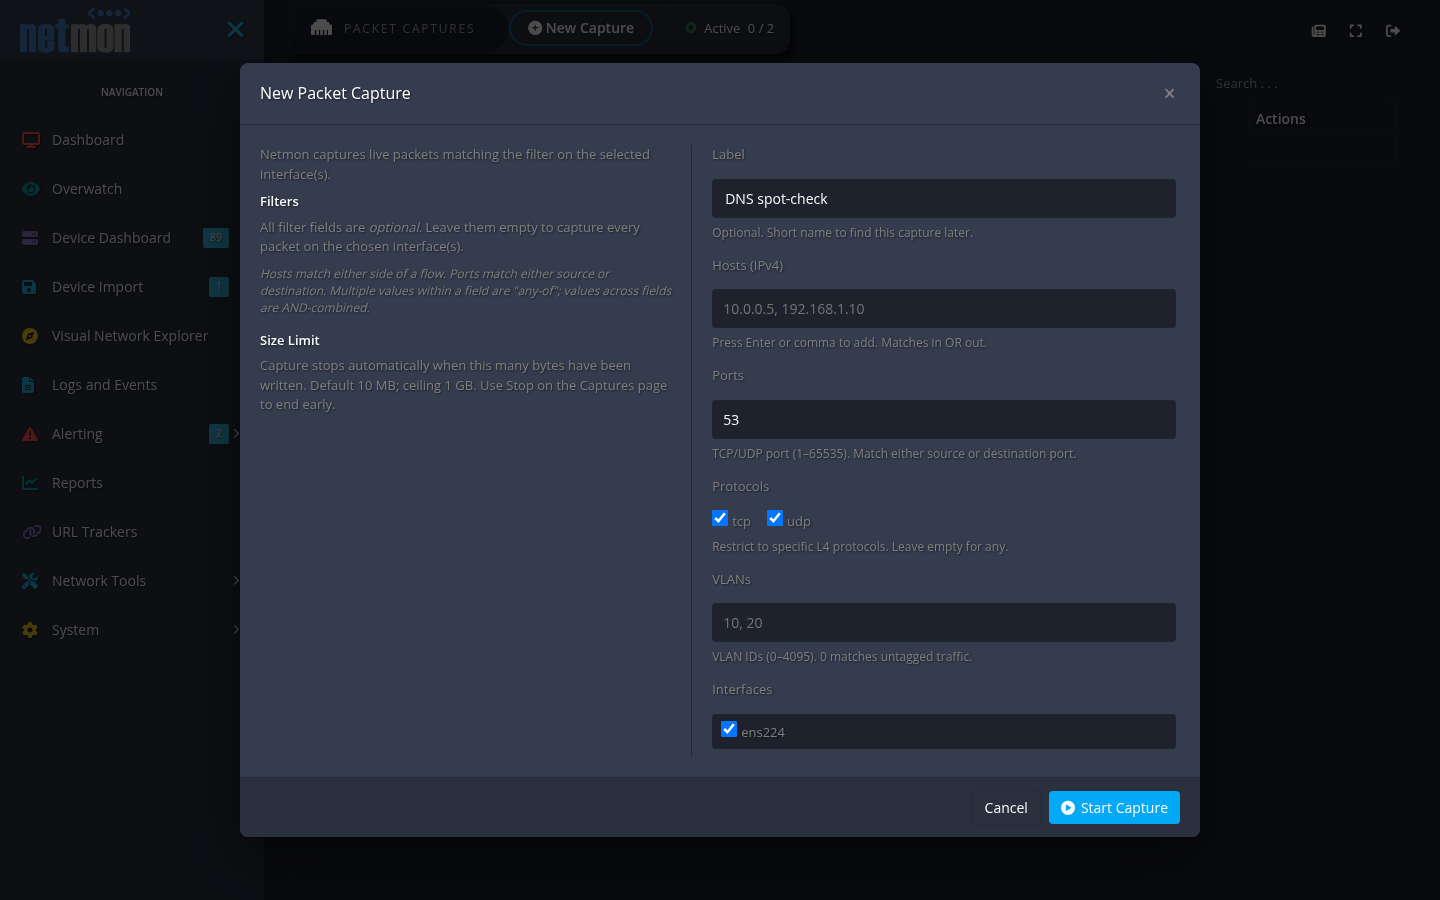
- New capture. Give it a label and choose the interface(s) to listen on.
- Filter. Narrow by host, port, protocol, and VLAN — a capture scoped to the conversation under suspicion stays small and readable. The byte cap protects you from the capture that was accidentally left running: when it is reached, the capture stops on its own.
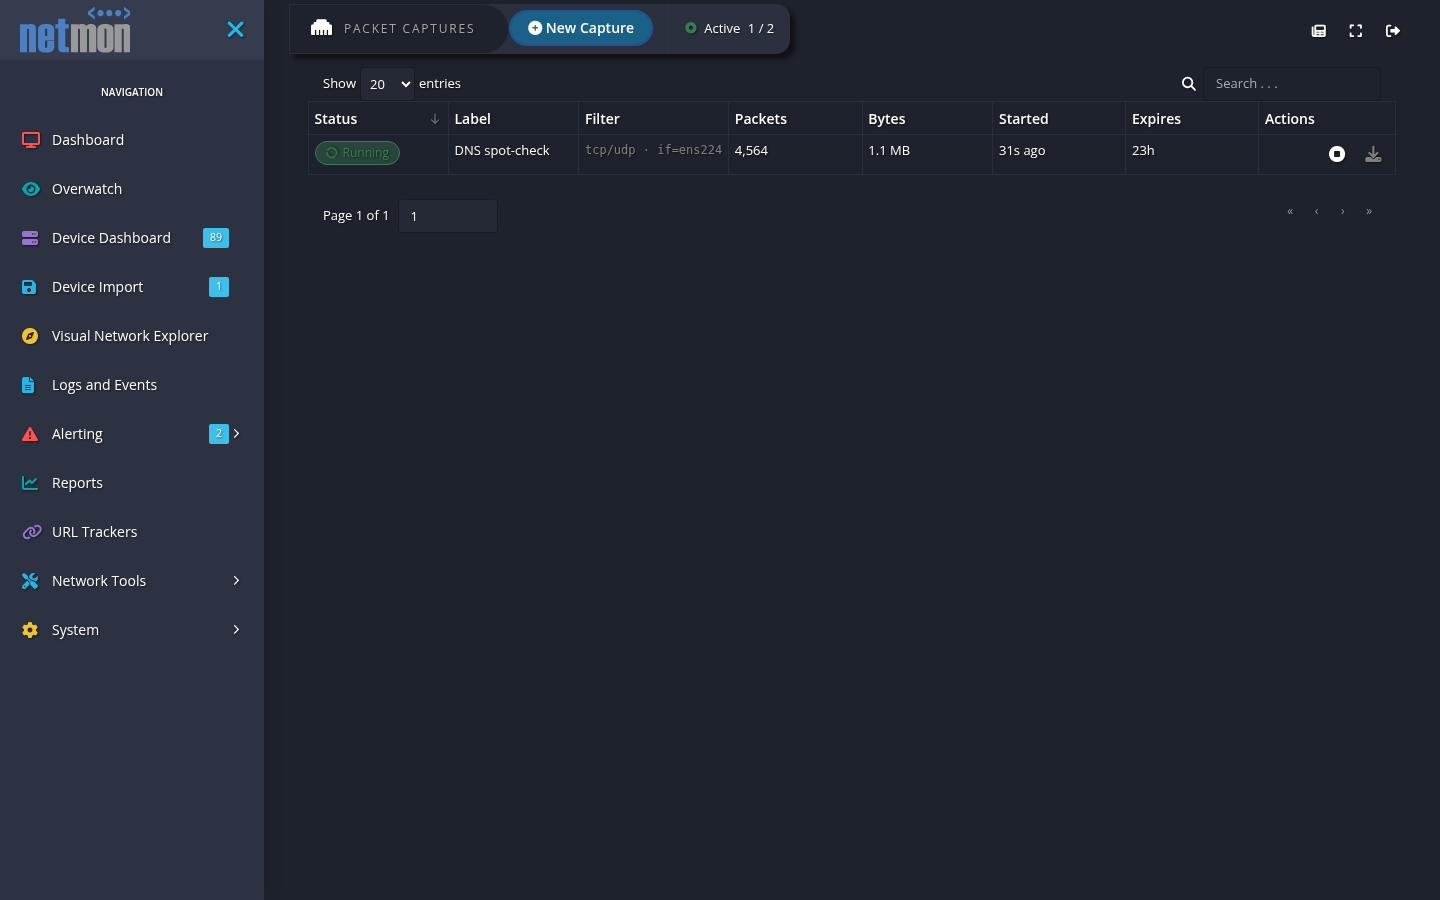
- Start. The capture runs live; its row shows packet and byte counters climbing. Stop it manually or let the cap do it.
Because a capture is a filter on the continuous stream rather than a new process, it starts instantly and adds almost nothing while it runs. A small number can run concurrently; the appliance enforces the limit so capture work can never degrade the monitoring itself.
Retrieving the result
Download the assembled .pcapng from the capture’s row and open it in Wireshark. Capture files age out on a schedule (they are diagnostic artifacts, not records), so download anything you intend to keep.
Captures are private to the user who created them; Super Admin accounts see all. The Packet Capture permission gates the entire feature.
Live streaming into Wireshark
For the workflow where you want packets as they arrive, the Wireshark integration (under System → System Settings → Downloadables) installs a Netmon entry in Wireshark’s interface list on your workstation. Selecting it streams a running appliance capture straight into the Wireshark window — start the capture in Netmon, watch it live at your desk. Installation and sign-in for that integration are covered in API & Integrations.
Packet captures contain whatever crossed the wire, including credentials and personal data on unencrypted protocols. Treat capture files as sensitive, share them deliberately, and delete them when the investigation closes.